
(a)
Interpretation:
The liquidus temperature for
Concept Introduction:
On the temperature-composition graph of an alloy, the curve above which the alloy exists in the liquid phase is the liquidus curve. The temperature at this curve is at maximum and is known as liquidus temperature. In it, the crystals in the alloy can coexist with its melt in the
Answer to Problem 10.80P
Liquidus temperature,
Explanation of Solution
The equilibrium phase diagram for the Nb-W system is shown below as:

A straight line from
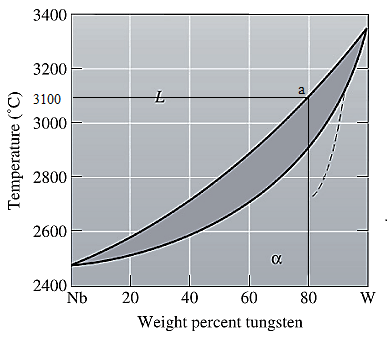
Liquidus temperature
(b)
Interpretation:
The solidus temperature for
Concept Introduction:
Solidus curve is the locus of the temperature on the temperature composition graph of an alloy, beyond which the alloy is completely in a solid phase. The temperature at this curve is minimum known as solidus temperature at which the crystals in the alloy can coexist with its melt in the thermodynamic equilibrium.
Answer to Problem 10.80P
Solidus temperature,
Explanation of Solution
The equilibrium phase diagram for the Nb-W system is shown below as:

A straight line from
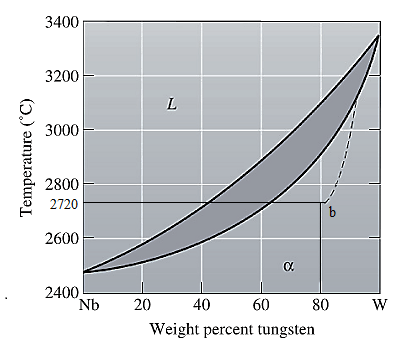
Solidus temperature
(c)
Interpretation:
The freezing range for
Concept Introduction:
Freezing range for an alloy is the difference of the liquidus and the solidus temperature of an alloy. In this range, the alloy melt starts to crystallize at liquidus temperature and solidifies when reaches solidus temperature.
Answer to Problem 10.80P
Freezing range,
Explanation of Solution
From part (a) and (b), the liquidus and solidus temperature for the given alloy is determined as:
The freezing range (FR) for this alloy composition will be:
(d)
Interpretation:
The composition of the first solid that is formed when
Concept Introduction:
On the temperature-composition graph of an alloy, the curve above which the alloy exists in the liquid phase is the liquidus curve. The temperature at this curve is maximum known as liquidus temperature at which the crystals in the alloy can coexist with its melt in the thermodynamic equilibrium.
Answer to Problem 10.80P
The composition of the first solid formed is
Explanation of Solution
The equilibrium phase diagram for the Nb-W system is shown below as:
A straight line from

Point 'a' represents the composition of the first solid which is formed when
(e)
Interpretation:
The composition of the last liquid which is solidified when
Concept Introduction:
On the temperature-composition graph of an alloy, the curve above which the alloy exists in the liquid phase is the liquidus curve. The temperature at this curve is at maximum, is known as liquidus temperature at which the crystals in the alloy can coexist with its melt in the thermodynamic equilibrium.
Solidus curve is the locus of the temperature on the temperature composition graph of an alloy, beyond which the alloy is completely in a solid phase.
Between the solidus and liquidus curve, the alloy exits in a slurry form in which there is both crystals as well as alloy melt.
Solidus temperature is always less than or equal to the liquidus temperature.
Answer to Problem 10.80P
The composition of the last liquid solidified is
Explanation of Solution
The equilibrium phase diagram for the Nb-W system is shown below as:

A straight line from
Point 'b' represents the composition of the last liquid which solidifies when
(f)
Interpretation:
The phases present, their compositions and their amounts for
Concept Introduction:
On the temperature-composition graph of an alloy, the curve above which the alloy exists in the liquid phase is the liquidus curve. The temperature at this curve is the maximum temperature at which the crystals in the alloy can coexist with its melt in the thermodynamic equilibrium.
Solidus curve is the locus of the temperature on the temperature composition graph of an alloy, beyond which the alloy is completely in a solid phase.
Between the solidus and liquidus curve, the alloy exits in a slurry form in which there is both crystals as well as alloy melt.
Solidus temperature is always less than or equal to the liquidus temperature.
Amount of each phase in wt% is calculated using lever rule. At a particular temperature and alloy composition, a tie line is drawn on the phase diagram of the alloy between the solidus and liquidus curve. Then the portion of the lever opposite to the phase whose amount is to be calculated is considered in the formula used as:
Answer to Problem 10.80P
Both solid, as well as liquid phases, are present at the given conditions.
Composition of the liquid phase present is
Composition of the solid phase present is
Amount of the liquid phase is
Amount of the solid phase is
Explanation of Solution
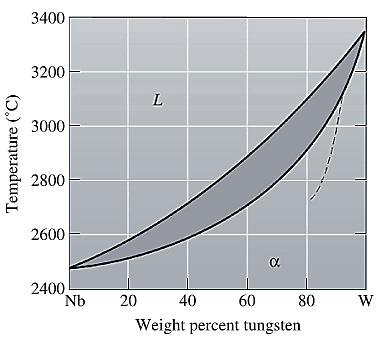
The equilibrium phase diagram for the Nb-W system is shown below as:

Now, draw a straight line from
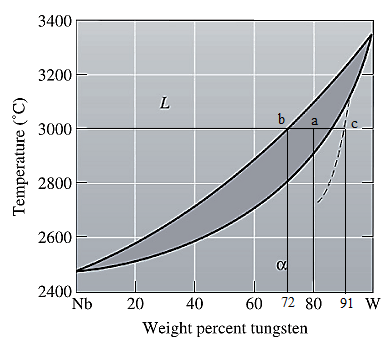
Both the phases, solid and liquid are present at this condition. Point 'b' represents the liquid phase composition in wt% and point 'c' represents the solid phase composition in wt% on the dashed curve. From the above phase diagram:
To calculate the amount of liquid phase, lever 'ac' will be used and to calculate the amount of solid phase, lever 'ba' will be used. Use equation (1) to calculate the amount of each phase as:
(g)
Interpretation:
The phases present, their compositions and their amounts for
Concept Introduction:
On the temperature-composition graph of an alloy, the curve above which the alloy exists in the liquid phase is the liquidus curve. The temperature at this curve is the maximum temperature at which the crystals in the alloy can coexist with its melt in the thermodynamic equilibrium.
Solidus curve is the locus of the temperature on the temperature composition graph of an alloy, beyond which the alloy is completely in a solid phase.
Between the solidus and liquidus curve, the alloy exits in a slurry form in which there is both crystals as well as alloy melt.
Solidus temperature is always less than or equal to the liquidus temperature.
Amount of each phase in wt% is calculated using lever rule. At a particular temperature and alloy composition, a tie line is drawn on the phase diagram of the alloy between the solidus and liquidus curve. Then the portion of the lever opposite to the phase whose amount is to be calculated is considered in the formula used as:
Answer to Problem 10.80P
Both solid, as well as liquid phases, are present at the given conditions.
Composition of the liquid phase present is
Composition of the solid phase present is
Amount of the liquid phase is
Amount of the solid phase is
Explanation of Solution
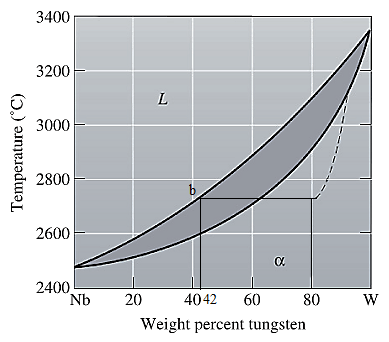
The equilibrium phase diagram for the Nb-W system is shown below as:

Now, draw a straight line from
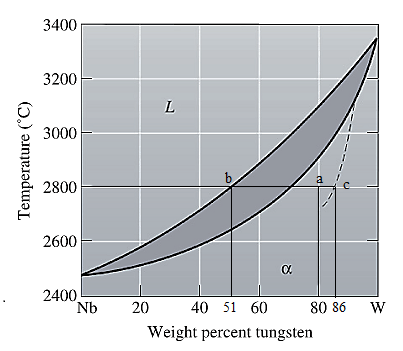
Both the phases, solid and liquid are present at this non-equilibrium condition. Point 'b' represents the liquid phase composition in wt% and point 'c' represents the solid phase composition in wt% at non-equilibrium conditions. From the above phase diagram:
To calculate the amount of liquid phase, lever 'ac' will be used and to calculate the amount of solid phase, lever 'ba' will be used. Use equation (1) to calculate the amount of each phase as:
Want to see more full solutions like this?
Chapter 10 Solutions
ESS.MAT.SCI (LL W/MINDTAP)

 MATLAB: An Introduction with ApplicationsEngineeringISBN:9781119256830Author:Amos GilatPublisher:John Wiley & Sons Inc
 Essentials Of Materials Science And EngineeringEngineeringISBN:9781337385497Author:WRIGHT, Wendelin J.Publisher:Cengage,
 Industrial Motor ControlEngineeringISBN:9781133691808Author:Stephen HermanPublisher:Cengage Learning
 Basics Of Engineering EconomyEngineeringISBN:9780073376356Author:Leland Blank, Anthony TarquinPublisher:MCGRAW-HILL HIGHER EDUCATION
 Structural Steel Design (6th Edition)EngineeringISBN:9780134589657Author:Jack C. McCormac, Stephen F. CsernakPublisher:PEARSON
 Fundamentals of Materials Science and Engineering...EngineeringISBN:9781119175483Author:William D. Callister Jr., David G. RethwischPublisher:WILEY