
Concept explainers
a)
To construct: A
Introduction: Quality is a measure of excellence or a state of being free from deficiencies, defects and important variations. It is obtained by consistent and strict commitment to certain standards to attain uniformity of a product to satisfy consumers’ requirement.
a)
Answer to Problem 12P
Explanation of Solution
Given information:
| Sample | Mean | Sample | Mean | Sample | Mean | Sample | Mean |
| 1 | 3.86 | 11 | 3.88 | 21 | 3.84 | 31 | 3.88 |
| 2 | 3.90 | 12 | 3.86 | 22 | 3.82 | 32 | 3.76 |
| 3 | 3.83 | 13 | 3.88 | 23 | 3.89 | 33 | 3.83 |
| 4 | 3.81 | 14 | 3.81 | 24 | 3.86 | 34 | 3.77 |
| 5 | 3.84 | 15 | 3.83 | 25 | 3.88 | x35 | 3.86 |
| 6 | 3.83 | 16 | 3.86 | 26 | 3.90 | 36 | 3.80 |
| 7 | 3.87 | 17 | 3.82 | 27 | 3.81 | 37 | 3.84 |
| 8 | 3.88 | 18 | 3.86 | 28 | 3.86 | 38 | 3.79 |
| 9 | 3.84 | 19 | 3.84 | 29 | 3.98 | 39 | 3.85 |
| 10 | 3.80 | 20 | 3.87 | 30 | 3.96 |
Formula:
Calculation of control limits and construction of
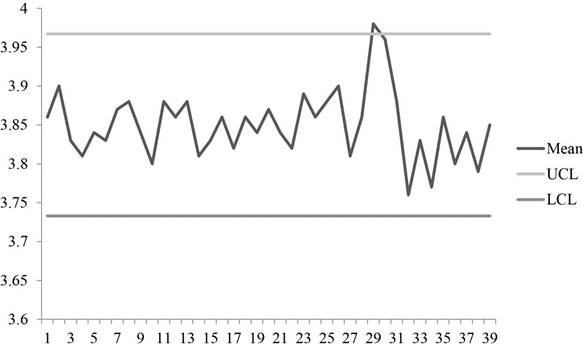
Graph shows the plot for sample means with UCL and LCL values. It can be observed that some points are above the control limits. So, the process is out of control.
Hence, the process is not in control.
b)
To analyze: The data using median run test and up and down run test and conclude the results.
Introduction: Quality is a measure of excellence or a state of being free from deficiencies, defects and important variations. It is obtained by consistent and strict commitment to certain standards to attain uniformity of a product to satisfy consumers’ requirement.
b)
Answer to Problem 12P
Explanation of Solution
Given information:
| Sample | Mean | Sample | Mean | Sample | Mean | Sample | Mean |
| 1 | 3.86 | 11 | 3.88 | 21 | 3.84 | 31 | 3.88 |
| 2 | 3.90 | 12 | 3.86 | 22 | 3.82 | 32 | 3.76 |
| 3 | 3.83 | 13 | 3.88 | 23 | 3.89 | 33 | 3.83 |
| 4 | 3.81 | 14 | 3.81 | 24 | 3.86 | 34 | 3.77 |
| 5 | 3.84 | 15 | 3.83 | 25 | 3.88 | x35 | 3.86 |
| 6 | 3.83 | 16 | 3.86 | 26 | 3.90 | 36 | 3.80 |
| 7 | 3.87 | 17 | 3.82 | 27 | 3.81 | 37 | 3.84 |
| 8 | 3.88 | 18 | 3.86 | 28 | 3.86 | 38 | 3.79 |
| 9 | 3.84 | 19 | 3.84 | 29 | 3.98 | 39 | 3.85 |
| 10 | 3.80 | 20 | 3.87 | 30 | 3.96 |
Formula:
Analysis of data:
To make analysis of data, the given data is compared with median 3.85 to make A/B and U/D.
| Sample | A/B | Mean | U/D | Sample | A/B | Mean | U/D |
| 1 | A | 3.86 | - | 21 | B | 3.84 | D |
| 2 | A | 3.90 | U | 22 | B | 3.82 | D |
| 3 | B | 3.83 | D | 23 | A | 3.89 | U |
| 4 | B | 3.81 | D | 24 | A | 3.86 | D |
| 5 | B | 3.84 | U | 25 | A | 3.88 | U |
| 6 | B | 3.83 | D | 26 | A | 3.90 | U |
| 7 | A | 3.87 | U | 27 | B | 3.81 | D |
| 8 | A | 3.88 | U | 28 | A | 3.86 | U |
| 9 | B | 3.84 | D | 29 | A | 3.98 | U |
| 10 | B | 3.80 | D | 30 | A | 3.96 | D |
| 11 | A | 3.88 | U | 31 | A | 3.88 | D |
| 12 | A | 3.86 | D | 32 | B | 3.76 | D |
| 13 | A | 3.88 | U | 33 | B | 3.83 | U |
| 14 | B | 3.81 | D | 34 | B | 3.77 | D |
| 15 | B | 3.83 | U | 35 | A | 3.86 | U |
| 16 | A | 3.86 | U | 36 | B | 3.80 | D |
| 17 | B | 3.82 | D | 37 | B | 3.84 | U |
| 18 | A | 3.86 | U | 38 | B | 3.79 | D |
| 19 | B | 3.84 | D | 39 | B | 3.85 | U |
| 20 | A | 3.87 | U |
Sample 39 ties with the median and in order to maximize the Ztest statistics, the sample 39 is labeled as B. Therefore, the observed number of runs is 18.
Median run test:
Calculation of expected number of runs:
The expected number of runs is calculated by adding half of the total number of samples with 1 which gives 20.5.
Calculation of standard deviation:
Standard deviation is calculated by subtracting number of sample 39 from 1 and dividing the resultant by 4 and taking square for the value which yields 3.08.
The z factor for median is calculated by dividing the difference of 18 and 20.5 with 3.08 which yields -0.81 which is within the test statistics of ±2.
Up/Down Test:
The observed number of runs from the analysis is 29.
Calculation of expected number of runs:
The expected number of runs is calculated by subtracting the double of the number of samples 39 and subtracting from1 and dividing the resultant with 3 which gives 25.7.
Calculation of standard deviation:
Standard deviation is calculated by multiplying the number of samples with 16 and subtracting the resultant from 29 and then dividing the resulting value with 90 and taking square root which yields 2.57.
The z factor for median is calculated by dividing the difference of 29 and 25.7 with 2.57 which yields +1.28 which is within the test statistics of ±2.
Hence, the results of the median run test and up/down test is random and no non randomness is detected.
Want to see more full solutions like this?
Chapter 10 Solutions
OPERATIONS MANAGEMENT (LL) >CUSTOM<


- A process considered to be in control measures an ingredient in ounces. A quality inspector took 10 samples, each with 5 observations as follows: SEE ATTACHED PHOTO Using this information, obtain three-sigma (i.e., z=3) control limits for a mean control chart and control limits for a range chart, respectively. It is known from previous experience that the standard deviation ofthe process is 1.36.arrow_forwardUsing samples of 197 credit card statements, an auditor found the following: Sample 1 3 errors Sample 2 3 errors Sample 3 5 errors Sample 4 9 errors 1. what alpha risk would control limits of .0470 and .0038 provide? 2. Using control limits of .0470 and .0038, is the process in control? 3. Construct a control chart for the process, assuming a fraction defective of 2 percent, using two-sigma control limits. Is the process in control?arrow_forwardA process considered to be in control measures an ingredient in ounces. Roberto Baggio, a quality inspector took 20 samples, each with 8 observations as follows: thats in the pictuer after that using this information, obtain three-sigma (i.e., z=3) control limits for a mean control chart and control limits for a range chart, respectively. It is known from previous experience that the standard deviation of the process is 0.693. First: perform all actions and calculations needed to answer the question. All equations/calculations needed to be fully written STEP by STEP. No short calculations or direct answers/results will be accepted. This applies to the calculations for both types of control limits (mean and range). Second: Explain the process followed to identify each type of control limit and any observations made in the problem-solving process. thank you very mucharrow_forward
- A quality inspector took five samples in five hours, each with four observations, of the length time for glue to dry. The analyst compute the mean of each sample and the computed the grand mean. All values are in minutes. Use this information to obtain three-sigma control limits for means. It is known from previous experience that the standard deviation of the process is 0.02 minutes. Draw a control chart Please provide a step-by-step solutionarrow_forwardStudies on a machine that molds plastic water pipe indicate that when it is injecting1-inch diameter pipe, the process standard deviation is 0.05 inches. The one-inchpipe has a specification of 1-inch plus or minus 0.10 inch. What is the processcapability index (Cp) if the long-run process mean is 1 inch?arrow_forwardMcDaniel Shipyards wants to develop control charts to assess the quality of its steel plate. They take ten sheets of 1" steel plate and compute the number of cosmetic flaws on each roll. Each sheet is 20' by 100'. Based on the following data, develop limits for the control chart, plot the control chart, and determine whether the process is in control. Sheet Number of flaws 1 1 2 1 3 2 4 0 5 1 6 5 7 0 8 2 9 0 10 2arrow_forward
- A can filling process at a beverage manufacturing factory is assumed to be in control with limits of 89 plus/minus 4 had sample averages for the x-bar chart of the following : 87.1, 87, 87.2, 89, 90, 88.5, 89.5 and 88. Which of the following statement below are correct? a. None is correct b. Not enough information to determine c. Process mean is out -of-control d . Process mean is NOT out-of-controlarrow_forwardAn automatic filling machine is used to fill 1-liter bottles of cola. The machine’s output is approximately normal with a mean of 1.0 liter and standard deviation of .01 liter. Output is monitored using means of samples of 25 observations. Determine upper and lower control limits that will include roughly 97% of the sample means when the process is in control. Using Appendix B, Table A to find the value of Z corresponding to the mean control limits.arrow_forwardYour supervisor, Lisa Lehmann, has asked that you report on the output of a machine on the factory floor. This machine is supposed to be producing optical lenses with a meanweight of 50 grams and a range of 3.5 grams. The following table contains the data for a sample size of n = 6 taken during the past 3 hours: a) What are the :X-chart control limits when the machine is working properly?b) What are the R-charL control limits when the machine is working properly?c) What seems to be happening? (Hint: Graph the data points. Run charts may be helpful.)arrow_forward
- The inner diameter of piston rings follows a normal distribution with mean 75mm and variance =9. The sample size is 5, X-bar chart is established. If L =2, what is the type I error rate when process is in-control? If we change the control limits to UCL = 78.354, and LCL = 71.646, what is Type I error rate?arrow_forwardWhat trade-offs are involved in each of these decisions?a. Deciding whether to use two-sigma or three-sigma control limits.b. Choosing between a large sample size and a smaller sample size.c. Trying to increase the capability of a process that is barely capable.arrow_forwardAspen Plastics produces plastic bottles to customer order.The quality inspector randomly selects four bottles fromthe bottle machine and measures the outside diameter ofthe bottle neck, a critical quality dimension that determineswhether the bottle cap will fit properly. The dimensions(inch) from the last six samples are Assume that only these six samples are sufficient, and use thedata to determine control limits for an R- and an x-chart.arrow_forward
 Practical Management ScienceOperations ManagementISBN:9781337406659Author:WINSTON, Wayne L.Publisher:Cengage,
 Operations ManagementOperations ManagementISBN:9781259667473Author:William J StevensonPublisher:McGraw-Hill Education
 Operations and Supply Chain Management (Mcgraw-hi...Operations ManagementISBN:9781259666100Author:F. Robert Jacobs, Richard B ChasePublisher:McGraw-Hill Education
 Purchasing and Supply Chain ManagementOperations ManagementISBN:9781285869681Author:Robert M. Monczka, Robert B. Handfield, Larry C. Giunipero, James L. PattersonPublisher:Cengage Learning
 Production and Operations Analysis, Seventh Editi...Operations ManagementISBN:9781478623069Author:Steven Nahmias, Tava Lennon OlsenPublisher:Waveland Press, Inc.