
Concept explainers
Videos
(a)
To graph: A
(a)
Explanation of Solution
Given: The data for the average debt, percentage of students who borrow, admittance rate, four-year graduation rate, in-state tuition after aid, out-of-state tuition after aid, average aid per student and the number of students per faculty member 40 colleges in US.
| College | Admit | Yr4Grad | StudPerFac | InAfterAid | OutAfterAid | AvgAid | PercBorrow | AvgDebt |
| The University of Arizona, Tucson | 75 | 34 | 20 | 9565 | 25775 | 9261 | 44 | 20074 |
| Stony Brook University, State University of New York, Stony Brook | 41 | 43 | 19 | 11193 | 20643 | 7275 | 59 | 19807 |
| University of Illinois at Springfield, Springfield | 59 | 50 | 14 | 11489 | 20639 | 8213 | 61 | 17335 |
| State University of New York College at Oneonta, Oneonta | 41 | 48 | 17 | 12649 | 21699 | 5311 | 75 | 17564 |
| Iowa State University of Science and Technology, Ames | 81 | 37 | 17 | 9738 | 21610 | 6413 | 69 | 30062 |
| University of South Florida, Tampa | 45 | 24 | 28 | 10598 | 19788 | 5966 | 52 | 21679 |
| University of New Hampshire, Durham | 73 | 61 | 18 | 21947 | 35267 | 3955 | 76 | 35671 |
| University of North Florida, Jacksonville | 51 | 20 | 21 | 9171 | 21922 | 5789 | 39 | 15300 |
| University of South Carolina, Columbia | 70 | 46 | 19 | 14117 | 30301 | 5027 | 49 | 21811 |
| State University of New York College at Brockport, Brockport | 42 | 42 | 18 | 12888 | 21938 | 5140 | 80 | 25733 |
| The University of North Carolina at Chapel Hill, Chapel Hill | 32 | 76 | 14 | 6548 | 26374 | 11080 | 31 | 16165 |
| Towson University, Towson | 57 | 40 | 17 | 11627 | 23139 | 7601 | 56 | 19069 |
| University of California, Santa Barbara, Santa Barbara | 46 | 64 | 17 | 12711 | 34521 | 15389 | 47 | 17596 |
| St. Mary's College of Maryland, St. Mary's City | 65 | 74 | 12 | 17696 | 29773 | 8664 | 70 | 17505 |
| University of Georgia, Athens | 59 | 54 | 19 | 10288 | 28498 | 8970 | 45 | 15938 |
| Christopher Newport University, Newport News | 60 | 42 | 17 | 15725 | 24947 | 5087 | 51 | 21572 |
| The Ohio State University, Columbus | 68 | 49 | 19 | 12680 | 27575 | 7789 | 59 | 22830 |
| University of Delaware, Newark | 54 | 62 | 12 | 15728 | 31998 | 6734 | 44 | 17200 |
| California State Polytechnic University, Pomona, Pomona | 45 | 20 | 26 | 10701 | 21861 | 8280 | 35 | 16704 |
| University of Illinois at Urbana–Champaign, Champaign | 67 | 67 | 16 | 14809 | 28951 | 10885 | 51 | 21543 |
| Auburn University, Auburn University | 79 | 36 | 18 | 13057 | 27649 | 6733 | 46 | 24777 |
| The University of Alabama, Tuscaloosa | 54 | 38 | 19 | 11584 | 24884 | 6680 | 53 | 26701 |
| University of Wisconsin–Madison, Madison | 58 | 51 | 17 | 12733 | 28483 | 5857 | 48 | 22837 |
| The University of Texas at Dallas, Richardson | 50 | 42 | 19 | 14068 | 31094 | 6664 | 41 | 17384 |
| State University of New York at Binghamton, Binghamton | 40 | 66 | 21 | 13310 | 21420 | 6716 | 50 | 21110 |
| Rutgers, The State University of New Jersey, New Brunswick/Piscataway, Piscataway | 59 | 53 | 15 | 15629 | 28291 | 9937 | 68 | 16766 |
| University of Science and Arts of Oklahoma, Chickasha | 56 | 18 | 14 | 4132 | 11092 | 7098 | 29 | 15339 |
| Miami University, Oxford | 79 | 68 | 17 | 19310 | 34482 | 6083 | 51 | 27315 |
| University of Maryland, College Park, College Park | 44 | 63 | 18 | 12450 | 29821 | 6959 | 43 | 22696 |
| New College of Florida, Sarasota | 53 | 57 | 10 | 5316 | 28345 | 10142 | 36 | 11458 |
| The University of North Carolina at Asheville, Asheville | 77 | 30 | 14 | 7443 | 21075 | 6202 | 48 | 15443 |
| University of Mary Washington, Fredericksburg | 77 | 68 | 15 | 12206 | 23934 | 6500 | 57 | 15600 |
| University of California, Los Angeles, Los Angeles | 23 | 68 | 17 | 15397 | 38275 | 12777 | 45 | 16733 |
| University of Virginia, Charlottesville | 33 | 85 | 16 | 5138 | 29460 | 16488 | 32 | 19384 |
| University of California, Berkeley, Berkeley | 22 | 69 | 17 | 13164 | 36042 | 15863 | 41 | 16056 |
| University of Oklahoma, Norman | 85 | 33 | 18 | 11417 | 22370 | 6011 | 52 | 21517 |
| The University of North Carolina at Wilmington, Wilmington | 57 | 45 | 17 | 7367 | 19188 | 6792 | 25 | 19277 |
| University of Connecticut, Storrs | 54 | 66 | 18 | 14403 | 31299 | 8167 | 63 | 23237 |
| University of Michigan, Ann Arbor | 51 | 72 | 15 | 13170 | 38842 | 10783 | 46 | 27828 |
| University of Colorado at Boulder, Boulder | 83 | 41 | 18 | 14549 | 35727 | 7873 | 43 | 19758 |
Graph: To draw the scattered plot of each explanatory variable with AvgDebt of the provided data, below mentioned steps are followed in Minitab.
Step 1: Enter the data into Minitab worksheet.
Step 2: Go to Graph, select Matrix Plot, select Each Y versus each X and select Simple.
Step 3: Select AvgDebt as Y variable and Admit, Yr4Grad, StudPerFac, InAfterAid, OutAfterAid, AvgAid, PercBorrow.
Step 4: Press “OK”.
The obtained scattered plot is as follows:
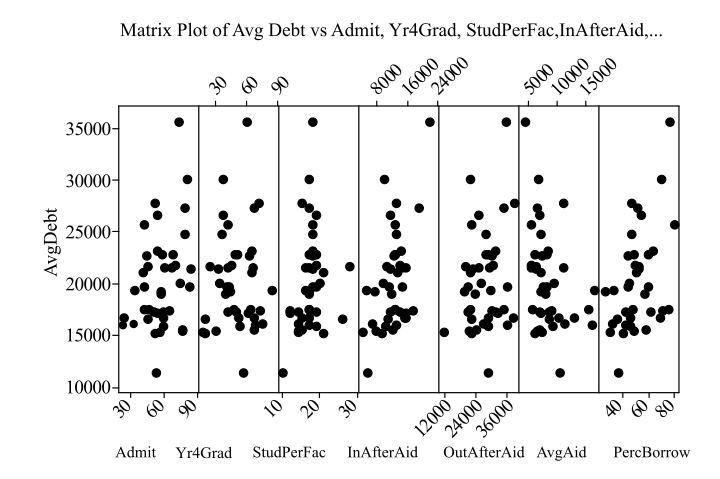
Interpretation: The obtained scattered plot shows that the relationship between AvgDebt and AvgAid is negative linear while with all other variable it is positively linear.
(b)
To find: The Curves which fit the each of the predictors separately and to create a table which lists the explanatory variable, model standard deviation
(b)
Answer to Problem 14E
Solution: The table that shows the models for each explanatory variable, model standard deviation
| Explanatory variable | Model | Model standard deviation s | P-value |
| Admit, | |||
| Yr4Grad | |||
| StudPerFac | |||
| InAfterAid | |||
| OutAfterAid | |||
| AvgAid | |||
| PercBorrow |
Explanation of Solution
Given: The data for the average debt, percentage of students who borrow, admittance rate, four-year graduation rate, in-state tuition after aid, out-of-state tuition after aid, average aid per student and the number of students per faculty member 40 colleges in US.
| College | Admit | Yr4Grad | StudPerFac | InAfterAid | OutAfterAid | AvgAid | PercBorrow | AvgDebt |
| The University of Arizona, Tucson | 75 | 34 | 20 | 9565 | 25775 | 9261 | 44 | 20074 |
| Stony Brook University, State University of New York, Stony Brook | 41 | 43 | 19 | 11193 | 20643 | 7275 | 59 | 19807 |
| University of Illinois at Springfield, Springfield | 59 | 50 | 14 | 11489 | 20639 | 8213 | 61 | 17335 |
| State University of New York College at Oneonta, Oneonta | 41 | 48 | 17 | 12649 | 21699 | 5311 | 75 | 17564 |
| Iowa State University of Science and Technology, Ames | 81 | 37 | 17 | 9738 | 21610 | 6413 | 69 | 30062 |
| University of South Florida, Tampa | 45 | 24 | 28 | 10598 | 19788 | 5966 | 52 | 21679 |
| University of New Hampshire, Durham | 73 | 61 | 18 | 21947 | 35267 | 3955 | 76 | 35671 |
| University of North Florida, Jacksonville | 51 | 20 | 21 | 9171 | 21922 | 5789 | 39 | 15300 |
| University of South Carolina, Columbia | 70 | 46 | 19 | 14117 | 30301 | 5027 | 49 | 21811 |
| State University of New York College at Brockport, Brockport | 42 | 42 | 18 | 12888 | 21938 | 5140 | 80 | 25733 |
| The University of North Carolina at Chapel Hill, Chapel Hill | 32 | 76 | 14 | 6548 | 26374 | 11080 | 31 | 16165 |
| Towson University, Towson | 57 | 40 | 17 | 11627 | 23139 | 7601 | 56 | 19069 |
| University of California, Santa Barbara, Santa Barbara | 46 | 64 | 17 | 12711 | 34521 | 15389 | 47 | 17596 |
| St. Mary's College of Maryland, St. Mary's City | 65 | 74 | 12 | 17696 | 29773 | 8664 | 70 | 17505 |
| University of Georgia, Athens | 59 | 54 | 19 | 10288 | 28498 | 8970 | 45 | 15938 |
| Christopher Newport University, Newport News | 60 | 42 | 17 | 15725 | 24947 | 5087 | 51 | 21572 |
| The Ohio State University, Columbus | 68 | 49 | 19 | 12680 | 27575 | 7789 | 59 | 22830 |
| University of Delaware, Newark | 54 | 62 | 12 | 15728 | 31998 | 6734 | 44 | 17200 |
| California State Polytechnic University, Pomona, Pomona | 45 | 20 | 26 | 10701 | 21861 | 8280 | 35 | 16704 |
| University of Illinois at Urbana–Champaign, Champaign | 67 | 67 | 16 | 14809 | 28951 | 10885 | 51 | 21543 |
| Auburn University, Auburn University | 79 | 36 | 18 | 13057 | 27649 | 6733 | 46 | 24777 |
| The University of Alabama, Tuscaloosa | 54 | 38 | 19 | 11584 | 24884 | 6680 | 53 | 26701 |
| University of Wisconsin–Madison, Madison | 58 | 51 | 17 | 12733 | 28483 | 5857 | 48 | 22837 |
| The University of Texas at Dallas, Richardson | 50 | 42 | 19 | 14068 | 31094 | 6664 | 41 | 17384 |
| State University of New York at Binghamton, Binghamton | 40 | 66 | 21 | 13310 | 21420 | 6716 | 50 | 21110 |
| Rutgers, The State University of New Jersey, New Brunswick/Piscataway, Piscataway | 59 | 53 | 15 | 15629 | 28291 | 9937 | 68 | 16766 |
| University of Science and Arts of Oklahoma, Chickasha | 56 | 18 | 14 | 4132 | 11092 | 7098 | 29 | 15339 |
| Miami University, Oxford | 79 | 68 | 17 | 19310 | 34482 | 6083 | 51 | 27315 |
| University of Maryland, College Park, College Park | 44 | 63 | 18 | 12450 | 29821 | 6959 | 43 | 22696 |
| New College of Florida, Sarasota | 53 | 57 | 10 | 5316 | 28345 | 10142 | 36 | 11458 |
| The University of North Carolina at Asheville, Asheville | 77 | 30 | 14 | 7443 | 21075 | 6202 | 48 | 15443 |
| University of Mary Washington, Fredericksburg | 77 | 68 | 15 | 12206 | 23934 | 6500 | 57 | 15600 |
| University of California, Los Angeles, Los Angeles | 23 | 68 | 17 | 15397 | 38275 | 12777 | 45 | 16733 |
| University of Virginia, Charlottesville | 33 | 85 | 16 | 5138 | 29460 | 16488 | 32 | 19384 |
| University of California, Berkeley, Berkeley | 22 | 69 | 17 | 13164 | 36042 | 15863 | 41 | 16056 |
| University of Oklahoma, Norman | 85 | 33 | 18 | 11417 | 22370 | 6011 | 52 | 21517 |
| The University of North Carolina at Wilmington, Wilmington | 57 | 45 | 17 | 7367 | 19188 | 6792 | 25 | 19277 |
| University of Connecticut, Storrs | 54 | 66 | 18 | 14403 | 31299 | 8167 | 63 | 23237 |
| University of Michigan, Ann Arbor | 51 | 72 | 15 | 13170 | 38842 | 10783 | 46 | 27828 |
| University of Colorado at Boulder, Boulder | 83 | 41 | 18 | 14549 | 35727 | 7873 | 43 | 19758 |
Calculation: Use following steps to find the models in Minitab:
Step 1: Enter the data into Minitab worksheet.
Step 2: Go to Stat, select Regression, again select Regression.
Step 3: Select AvgDebt as Response and all Predictors one by one.
The models for each explanatory variable, model standard deviation
| Explanatory variable | Model | Model standard deviation s | P-value |
| Admit, | |||
| Yr4Grad | |||
| StudPerFac | |||
| InAfterAid | |||
| OutAfterAid | |||
| AvgAid | |||
| PercBorrow |
Interpretation: The regression line for the variable AvgAid is having a negative slope which verifies the conclusion drawn from the scattered plot in part (a).
(c)
The variable which appears to be best single predictor of average debt.
(c)
Answer to Problem 14E
Solution: InAfterAid is best single predictor of average debt.
Explanation of Solution
The model of each explanatory variable, model standard deviation
The independent variable with smallest P-value is the significant predictor of the model. As the P-value is minimum for the explanatory variable InAfterAid which is
Want to see more full solutions like this?
Chapter 10 Solutions
LaunchPad for Moore's Introduction to the Practice of Statistics (12 month access)


- Telemedicine. Health insurers are beginning to offer telemedicine services online that replace the common office visit. Wellpoint provides a video service that allows subscribers to connect with a physician online and receive prescribed treatments (Bloomberg Businessweek). Wellpoint claims that users of its LiveHealth Online service saved a significant amount of money on a typical visit. The data shown below ($), for a sample of 20 online doctor visits, are consistent with the savings per visit reported by Wellpoint. Assuming the population is roughly symmetric, construct a 95% confidence interval for the mean savings for a televisit to the doctor as opposed to an office visit. Savings perVisit ($)921055676937853348349487493824055409673100arrow_forwardhe application of data analytics to microeconomics could Question 26 options: improve a firm's decision-making as it relates to their competitors provide insights to global economic policy produce a forecast of national GDP none of the abovearrow_forwardState University has increased its tuition for in-state and out-of-state students in each of the past 5 years to offset cuts in its budget allocation from the state legislature. The university administration always thought that the number of applications received was independent of tuition; however, drops in applications and enrollments the past 2 years have proved this theory to be wrong. University admissions officials have developed the following relationships between the number of applicants who accept admission and enter State and the cost of tuition per semester (in-state) (out-of-state) The university would like to develop a planning model that will indicate the in-state and out-of-state tuitions, as well as the number of students that could be expected to enroll in the freshman class. The university doesn’t have enough classroom space for more than 1,400 freshmen, and it needs at least 700 freshmen to meet all its class-size x2 = 35,000 - 6t2 x1 = 21,000 - 12t1 (xi) (ti):…arrow_forward
- Profitability remains a challenge for banks and thrifts with less than $2 billion of assets. The business problem facing a bank analyst relates to the factors that affect return on assets (ROA), an indicator of how profitable a company is relative to its total assets. Data collected from a sample of 88 community banks include the ROA (%), the efficiency ratio (%), as a measure of bank productivity (the lower the efficiency ratio, the better), and total risk-based capital (%), as a measure of capital adequacy. Use the accompanying multiple linear regression results to complete parts (a) and (b) below. Variable Coefficient Standard Error t Statistic p-value Intercept −0.21762 0.39401 −0.55 0.5822 Efficiency Ratio, X1 0.01443 0.00498 2.90 0.0048 Risk-Based Capital, X2 0.04002 0.01034 3.87 0.0002 a. Construct a 95% confidence interval estimate of the population slope between ROA and efficiency…arrow_forwardProfitability remains a challenge for banks and thrifts with less than $2 billion of assets. The business problem facing a bank analyst relates to the factors that affect return on assets (ROA), an indicator of how profitable a company is relative to its total assets. Data collected from a sample of 88 community banks include the ROA (%), the efficiency ratio (%), as a measure of bank productivity (the lower the efficiency ratio, the better), and total risk-based capital (%), as a measure of capital adequacy. Use the accompanying multiple linear regression results to complete parts (a) and (b) below. Variable Coefficient Standard Error t Statistic p-value Intercept −0.21762 0.39401 −0.55 0.5822 Efficiency Ratio, X1 0.01443 0.00498 2.90 0.0048 Risk-Based Capital, X2 0.04002 0.01034 3.87 0.0002 Find the test statistic for X1. tSTAT=______ (Type an integer or a decimal. Do not round.)arrow_forwardImagine that you are planning an impact evaluation for a microfinance program for poor, rural farmers. The program provides microloans to farmers to enable them to buy fertilizer to increase their rice production. Your team is interested in examining the effects of the program on rice yield (as measured in pounds of rice per acre). When brainstorming possible designs, a member of your evaluation team suggests that you compare participating farmers’ rice yield a year before program launch to participating farmers’ rice yield a year after the program is launched. Question 5 Question text Which threats to internal validity are relevant in this proposed design? Describe at least two different threats to internal validity and discuss how they could bias program effect estimates. Be specific to the program described above.arrow_forward
- Profitability remains a challenge for banks and thrifts with less than $2 billion of assets. The business problem facing a bank analyst relates to the factors that affect return on assets (ROA), an indicator of how profitable a company is relative to its total assets. Data collected from a sample of 194 community banks include the ROA (%), the efficiency ratio (%), as a measure of bank productivity (the lower the efficiency ratio, the better), and total risk-based capital (%), as a measure of capital adequacy. A multiple linear regression model resulted in an SSR of 5.25 and an SSE of 125.02. Calculate the test statistic. FSTAT=____________ (Round to two decimal places as needed.)arrow_forwardThe amount of income spent on housing is an important component of the cost of living. The total costs of housing for homeowners might include mortgage payments, property taxes, and utility costs (water, heat, electricity). An economist selected a sample of 20 homeowners in New England and then calculated these total housing costs as a percent of monthly income, 5 years ago and now. The information is reported below. Is it reasonable to conclude the percent is less now than 5 years ago? Homeowner Five Years Ago Now Homeowner Five Years Ago Now 1 17 % 10 % 11 35 % 32 % 2 20 39 12 16 32 3 29 37 13 23 21 4 43 27 14 33 12 5 36 12 15 44 40 6 43 41 16 44 42 7 45 24 17 28 22 8 19 26 18 29 19 9 49 28 19 39 35 10 49…arrow_forwardClassify each scenario as a cross-sectional study or a longitudinal study. Make sure your answers are legible and spelled correctly. a. A group of kidney transplant recipients is followed for 10 years to determine the effectiveness of their transplant. b. While driving around town one day, a driver searches to find the gas station with the lowest price for regular unleaded gasoline in her neighborhood. c. A labor union conducts a study to determine if pay raises for its members have kept up with the rate of inflation over the last 5 years. d. An economist conducts a study to determine if prolonged periods of low interest rates have an influence on income disparities over time. e. A budget-conscious shopper tries to find the most inexpensive brand of mayonnaise during a trip to the supermarket one evening.arrow_forward
- Determine if the following scenarios involve an observational study or an experiment. Make sure your answers are legible and spelled correctly. A team of ecologists determines the different species of frogs that live in the local swamplands. A medical researcher divides patients into a treatment group and a control group to determine the effect of a new drug on overall cholesterol levels in patients. A medical insurance company determines the average cost to cover a tooth extraction procedure over the past 3 years. As part of a medical study to determine the effectiveness of a new technique for abdominal surgery, patients undergo the surgery with the new technique or with a traditional technique. The recovery time from surgery is then compared for the two different techniques. The general manager of a baseball team determines the on-base percentage (OBP) for his players over the past two seasons. A dietitian examined the effectiveness of a weight-loss program by randomly…arrow_forwardBenchmarks. Examine the following tables from the 2009 Financial Trend Monitoring Report for the Town of Oakdale that reports on fiscal year 2008. The performance indicators selected are total revenue and revenue per capita. The town provides three reference groups with which to compare Oakdale: Aaa-rated municipalities, comparison municipalities, and the state median. Since local government budgeting in this state is driven by the property tax levy cap, this is a key variable in comparing municipalities. Aaa-Rated Municipality FY08 Total Revenue FY08 Rev per Cap State Rank Comparison Municipality FY08 Total Revenue FY08 Rev per Cap State Rank Delta $ 49,794,904 $4,342 12 Dover $356,895,723 $3,521 27 Monroe 111,784,312 3,683 21 Oakdale 175,058,152 3,065 45 Schoolcraft 47,219,656 3,605 24 Cook 71,477,390 2,954…arrow_forwardwhat insight can you derive from this segmentation result ? Stores with ? store size and ? staff size seem to have low turnover and high-profit margins.arrow_forward
 Linear Algebra: A Modern IntroductionAlgebraISBN:9781285463247Author:David PoolePublisher:Cengage Learning