
Concept explainers
a)
To determine: The results of the run test.
Introduction: Run chart refers to a line graph that displays the recorded data based on the time sequence.
a)
Answer to Problem 14P
Explanation of Solution
Given information:
| Test | z-score |
| Median | +1.37 |
| Up/Down | +1.05 |
By observing the given data of median +1.37 (< ±2) and up/down +1.05 (< ±2), it can be concluded that they are within the statistical limits of ±2.
Hence, the result of the run test suggests that the output possess randomness.
b)
To determine: The results of the run test.
Introduction: Run chart refers to a line graph that displays the recorded data based on the time sequence.
b)
Answer to Problem 14P
Explanation of Solution
Given information:
Formula:
Calculation of expected number of runs:
Observed number of runs = 14
The expected number of runs is calculated by adding half of the total number of samples with 1 which gives 11.
Calculation of standard deviation:
Standard deviation is calculated by subtracting number of sample 20 from 1 and dividing the resultant by 4 and taking square for the value which yields 2.18.
The z factor for median is calculated by dividing the difference of 14 and 11 with 2.18 which yields +1.38 which is within the test statistics of ±2.00 and no non-randomness exist.
Up/Down Test:
The observed number of runs is 8.
Calculation of expected number of runs:
The expected number of runs is calculated by subtracting the double of the number of samples 20 and subtracting from1 and dividing the resultant with 3 which gives 13.
Calculation of standard deviation:
Standard deviation is calculated by multiplying the number of samples with 16 and subtracting the resultant from 29 and then dividing the resulting value with 90 and taking square root which yields 1.80.
The z factor for median is calculated by dividing the difference of 8 and 13 with 1.80 which yields -2.78 which is beyond the test statistics of ±2.00 which is non-random.
Hence, the result of the median run test is random and up/down test is no non randomness is detected.
c)
To determine: The results of the run test.
Introduction: Run chart refers to a line graph that displays the recorded data based on the time sequence.
c)
Answer to Problem 14P
Explanation of Solution
Given information:
| Cable | 1 | 2 | 3 | 4 | 5 | 6 | 7 | 8 | 9 | 10 | 11 | 12 | 13 | 14 |
| Defects | 2 | 3 | 1 | 0 | 1 | 3 | 2 | 0 | 2 | 1 | 3 | 1 | 2 | 0 |
Formula:
Analysis of data:
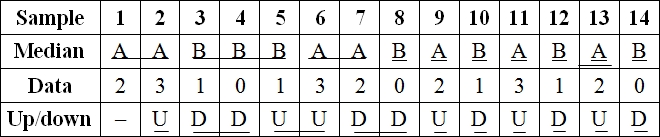
To make analysis of data, the given data is compared with median (center line) to make A/B and U/D which is shown below,
Median run test:
From analysis, the observed number of runs is 10 and median is 1.5.
Calculation of expected number of runs:
The expected number of runs is calculated by adding half of the total number of samples with 1 which gives 8.
Calculation of standard deviation:
Standard deviation is calculated by subtracting number of sample 14 from 1 and dividing the resultant by 4 and taking square for the value which yields 1.80.
The z factor for median is calculated by dividing the difference of 10 and 8 with 1.80 which yields +1.11 which is within the test statistics of ±2.00 and no non-randomness exist.
Up/Down Test:
The observed number of runs from the analysis is 10.
Calculation of expected number of runs:
The expected number of runs is calculated by subtracting the double of the number of samples 14 and subtracting from1 and dividing the resultant with 3 which gives 9.0.
Calculation of standard deviation:
Standard deviation is calculated by multiplying the number of samples with 14 and subtracting the resultant from 29 and then dividing the resulting value with 90 and taking square root which yields 1.47.
The z factor for median is calculated by dividing the difference of 10 and 9 with 1.47 which yields +0.68which is within the test statistics of ±2.00.
Hence, the results of the median run test and up/down test is random and no non randomness is detected.
d)
To determine:The results of the run test.
Introduction: Run chart refers to a line graph that displays the recorded data based on the time sequence.
d)
Answer to Problem 14P
Explanation of Solution
Given information:
| Day | 1 | 2 | 3 | 4 | 5 | 6 | 7 | 8 | 9 | 10 | 11 | 12 | 13 | 14 |
| Comp. | 4 | 10 | 14 | 8 | 9 | 6 | 5 | 12 | 13 | 7 | 6 | 4 | 2 | 10 |
Formula:
Analysis of data:
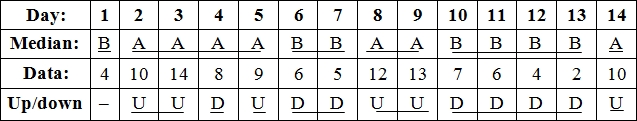
To make analysis of data, the given data is compared with median (center line) to make A/B and U/D which is shown below,
Median run test:
From analysis, the observed number of runs is 8.
Calculation of expected number of runs:
The expected number of runs is calculated by adding half of the total number of samples with 1 which gives 8.
Calculation of standard deviation:
Standard deviation is calculated by subtracting number of sample 14 from 1 and dividing the resultant by 4 and taking square for the value which yields 1.80.
The z factor for median is calculated by dividing the difference of 6 and 8 with 1.80 which yields -1.11 which is beyond the test statistics of ±2.00 and non-randomness exist.
Up/Down Test:
The observed number of runs from the analysis is 7.
Calculation of expected number of runs:
The expected number of runs is calculated by subtracting the double of the number of samples 26 and subtracting from1 and dividing the resultant with 3 which gives 9.0.
Calculation of standard deviation:
Standard deviation is calculated by multiplying the number of samples with 16 and subtracting the resultant from 29 and then dividing the resulting value with 90 and taking square root which yields 1.47.
The z factor for median is calculated by dividing the difference of 7 and 9 with 1.47 which yields -1.36 which is within the test statistics of ±2.00.
Hence, the results of the median run test and up/down test is random and no non randomness is detected.
Want to see more full solutions like this?
Chapter 10 Solutions
GEN COMBO CONNECT AC OPERATIONS MANAGEMENT; PRACTICE OP MANAGEMENT AC


- A process is in statistical control with = 202,5 y s = 2,0. Specifications are atLSL = 196 and USL = 206.a) Estimate the process capability with an appropriate process capability ratio.b) What is the potential capability of this process?c) Items that are produced below the lower specification limit must bescrapped, while items that are above the upper specification limit can bereworked. What proportion of the process output is scrap and whatproportion is rework?d) Because scrap is more expensive than rework, the process has been centered closer to the upper specification limit. If scrap is twice as expensive as rework, is the process mean at the best possible location? What value of the process target would you recommend?arrow_forwardSpecifications for a part for a DVD player state that the part should weigh between 24 and 25ounces. The process that produces the parts has a mean of 24.5 ounces and a standard deviation of.2 ounce. The distribution of output is normal.a. What percentage of parts will not meet the weight specs?arrow_forwardGive typing answer with explanation and conclusion Which of the following is the key objective of a six sigma project? A. Developing detailed control charts for critical processes' B. Reducing variation in critical processes' C. Reducing investment costs while improving output quality' D. Improve Efficiency at minimal cost'arrow_forward
- The following data were collected on the number of nonconformities per unit for 10 time periods. Complete parts (a) and (b). Time 1 2 3 4 5 6 7 8 9 10 Nonconformities Per Unit 23 11 14 15 6 14 11 9 13 6 What is the upper control limit? Select the correct choice below and fill in any answer boxes within your choice. A. UCL=enter your response here (Round to three decimal places as needed.) B. There is no upper control limit.arrow_forwardFigure 12–1 presents a conceptual picture of the trade-off between process cost and the costs of losses due to poor quality. What are the costs of poor quality and what difficulties might arise when attempting to measure these costs?arrow_forwardThe operations manager of thebooking services departmentof Hometown Bank is concerned about the number ofwrong customer account numbers recorded by Hometownpersonnel. Each week a random sample of 2,500 depositsis taken, and the number of incorrect account numbers is recorded. The results for the past12 weeks are shown in thefollowing table. Is the bookingprocess out of statistical control? Use three-sigma controllimits, which will provide a typeI error of 0.26 percent.arrow_forward
- One of New England Air's top competitive priorities is on-time arrivals. Quality VP Clair Bond decided to personally monitor New England Air's performance. Each week for the past 30 weeks, Bond checked a random sample of 100 flight arrivals for on-time performance. Sample (week) Late Flights Sample (week) Late Flights1 3 16 32 3 17 23 11 18 64 2 19 35 1 20 26 2 21 17 5 22 228 7 23 39 11 24 110 0 25 211 3 26 112 5 27 013 2 28 114 2 29 415 7 30 5 a) The overall fraction of late flights is [ 0.04 ] enter your response here (enter your response as a real number rounded to two decimal places.) Using a 95% confidence level, the upper and lower control limits are: Upper control limit (UCLp)= enter your response here [ ? ] (enter your response as a fraction between 0 and 1, rounded to four decimal places) Lower control limit (LCLp) =…arrow_forward86) PLEASE HELP ME WITH THIS Design specifications require that a key dimension on a product measure 106 = 11 units. A process being considered for producing this product has a standard deviation of four units. a. What can you say (quantitatively) regarding the process capability? Assume that the process is centered with respect to specifications.Note: Round your answer to 4 decimal places. b. Suppose the process average shifts to 97. Calculate the new process capability. Note: Round your answer to 4 decimal places.. c. What Is the probability of defective output after the process shift? Note: Use Excel's NORM.S.DIST function to find the correct probability. Round "z" values to 2 decimal places. Round y answer to 4 decimal places.arrow_forwardAnalysis of the output of a process has suggested that the variability is nonrandom on several occasions recently. However, each time an investigation has not revealed any assignable causes. What are some of the possible explanations for not finding any causes? What should the manager do? And Use the dimensions of quality to describe typical characteristics of these products and services such as a. A television set. b. Eating a meal in a restaurantarrow_forward
- Sam’s Long Life 60-watt light bulbs are designed to have a life of 1,350 hours with tolerance of ± 340 hours. A recent representative sample from the process that makes these light bulbs revealed a mean of 1,290 hours, with a standard deviation of 94 hours. Compute a. Compute the process capability ratio and the process capability index, and comment on the overall capability of the process b. Explain to what extent the process for producing Sam’s Long Life 60-watt light bulbs would have to be improved to achieve 4-sigma quality. c. show detail workarrow_forwardFlextronchip, an OEM manufacturer, has a fifth-generation chip for cell phones, with chip specification of 0.2 ± 0.0002 mm for the distance between two adjacent pins. The loss due to a defective chip has been estimated as $28. Required: 1. Compute the value of k, the cost coefficient in the Taguchi quality loss function (QLF), L(x) = k(x − T)2. 2. Assume that the quality control manager takes a sample of 100 chips from the production process. The results are as follows: Measurement Frequency 0.1996 2 0.1997 6 0.1998 14 0.1999 9 0.2000 45 0.2001 9 0.2002 8 0.2003 5 0.2004 2 a. & b. Use the appropriate Taguchi quality loss function, L(x), to calculate the estimated quality loss for each of the observed measurements. Additionally, calculate the expected (i.e., average) loss per unit for the production process as a whole.arrow_forwardOne of New England Air's top competitive priorities is on-time arrivals. Quality VP Clair Bond decided to personally monitor New England Air's performance. Each week for the past 30 weeks, Bond checked a random sample of 100 flight arrivals for on-time performance. Sample (week) Late Flights Sample (week) Late Flights1 4 16 32 3 17 23 11 18 104 2 19 25 1 20 16 2 21 17 4 22 208 7…arrow_forward
 Practical Management ScienceOperations ManagementISBN:9781337406659Author:WINSTON, Wayne L.Publisher:Cengage,
 Operations ManagementOperations ManagementISBN:9781259667473Author:William J StevensonPublisher:McGraw-Hill Education
 Operations and Supply Chain Management (Mcgraw-hi...Operations ManagementISBN:9781259666100Author:F. Robert Jacobs, Richard B ChasePublisher:McGraw-Hill Education
 Purchasing and Supply Chain ManagementOperations ManagementISBN:9781285869681Author:Robert M. Monczka, Robert B. Handfield, Larry C. Giunipero, James L. PattersonPublisher:Cengage Learning
 Production and Operations Analysis, Seventh Editi...Operations ManagementISBN:9781478623069Author:Steven Nahmias, Tava Lennon OlsenPublisher:Waveland Press, Inc.