
Concept explainers
Videos
Use a bar graph and a broken-line graph to graph the data on voter turnout, as a percentage of the population eligible to vote, in U.S. presidential elections.
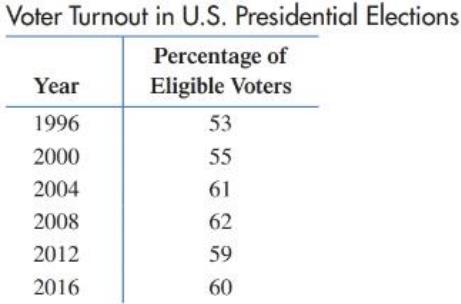
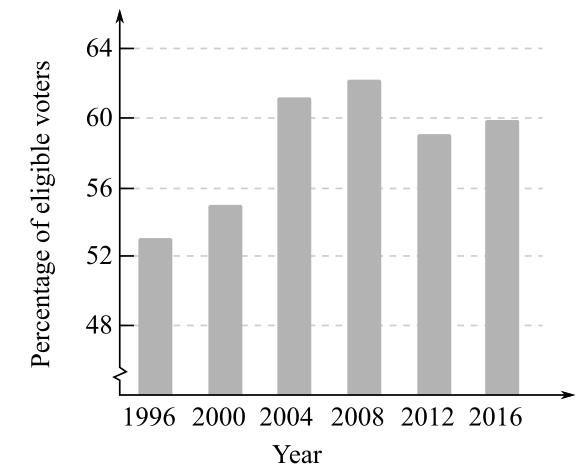
To graph:The data given in the following table for the voter turnout, as a percentage of the population eligible to vote, in U.S. presidential elections using a bar graph,
Explanation of Solution
Graph:
Consider the given table,
The percentage of eligible voters corresponding to the different years is known as the frequency. The frequencies are represented on the
Use the frequencies to draw the graph of the given data.
Thus, the bar graph of the given frequency table is,
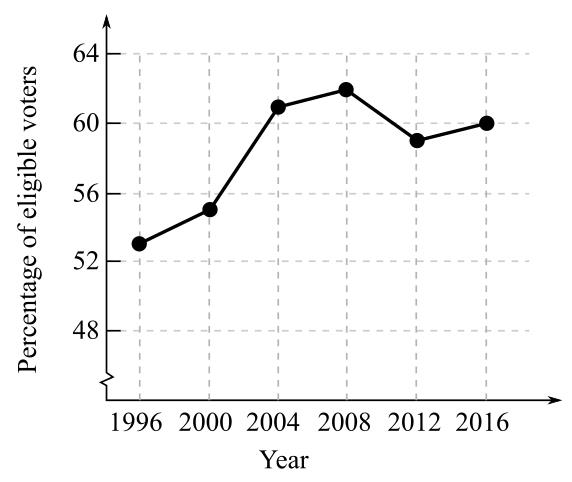
To graph:The data given in the following table for the voter turnout, as a percentage of the population eligible to vote, in U.S. presidential elections using a broken-line graph.
Explanation of Solution
Graph:
Consider the given table,
Voter Turnout in US Presidential Elections
A broken-line graph can be obtained from a vertical bar-graph by joining the mid-points of the tops of consecutive bars with straight lines.
The percentage of eligible voters corresponding to the different years is known as the frequency. The frequencies are represented on the
Use the frequencies to draw the graph of the given data.
Thus, the bar graph of the given frequency table is,
Want to see more full solutions like this?
Chapter 10 Solutions
Instructional Design:Readings: Readings
Additional Math Textbook Solutions
Fundamentals of Differential Equations and Boundary Value Problems
Finite Mathematics & Its Applications (12th Edition)
A Problem Solving Approach to Mathematics for Elementary School Teachers (12th Edition)
Calculus Volume 2
Mathematics with Applications In the Management, Natural and Social Sciences (11th Edition)
Mathematical Ideas (13th Edition) - Standalone book


 Algebra: Structure And Method, Book 1AlgebraISBN:9780395977224Author:Richard G. Brown, Mary P. Dolciani, Robert H. Sorgenfrey, William L. ColePublisher:McDougal Littell
 Big Ideas Math A Bridge To Success Algebra 1: Stu...AlgebraISBN:9781680331141Author:HOUGHTON MIFFLIN HARCOURTPublisher:Houghton Mifflin Harcourt
 Glencoe Algebra 1, Student Edition, 9780079039897...AlgebraISBN:9780079039897Author:CarterPublisher:McGraw Hill
 Holt Mcdougal Larson Pre-algebra: Student Edition...AlgebraISBN:9780547587776Author:HOLT MCDOUGALPublisher:HOLT MCDOUGAL