
Concept explainers
To determine: The difference shown by the second set of sample from the first one.
Introduction
Company TT is a division of company DM. It was about to launch a new product. Ms. MY, the
Table 1
| Sample | Mean | Range |
| 1 | 45.01 | 0.85 |
| 2 | 44.99 | 0.89 |
| 3 | 45.02 | 0.86 |
| 4 | 45 | 0.91 |
| 5 | 45.04 | 0.87 |
| 6 | 44.98 | 0.9 |
| 7 | 44.91 | 0.86 |
| 8 | 45.04 | 0.89 |
| 9 | 45 | 0.85 |
| 10 | 44.97 | 0.91 |
| 11 | 45.11 | 0.84 |
| 12 | 44.96 | 0.87 |
| 13 | 45 | 0.86 |
| 14 | 44.92 | 0.89 |
| 15 | 45.06 | 0.87 |
| 16 | 44.94 | 0.86 |
| 17 | 45 | 0.85 |
| 18 | 45.03 | 0.88 |
Quiet disappointed with the end results, the manager was figuring out ways to improve the process and free the capital expenditure of $10,000. A former professor suggested going for more samples with less sample sizes. JM conducted the analysis on 27 samples of 5 observations each and the results are tabulated below:
Table 2
| Sample | Mean | Range |
| 1 | 44.96 | 0.42 |
| 2 | 44.98 | 0.39 |
| 3 | 44.96 | 0.41 |
| 4 | 44.97 | 0.37 |
| 5 | 45.02 | 0.39 |
| 6 | 45.03 | 0.4 |
| 7 | 45.04 | 0.39 |
| 8 | 45.02 | 0.42 |
| 9 | 45.08 | 0.38 |
| 10 | 45.12 | 0.4 |
| 11 | 45.07 | 0.41 |
| 12 | 45.02 | 0.38 |
| 13 | 45.01 | 0.41 |
| 14 | 44.98 | 0.4 |
| 15 | 45 | 0.39 |
| 16 | 44.95 | 0.41 |
| 17 | 44.94 | 0.43 |
| 18 | 44.94 | 0.4 |
| 19 | 44.87 | 0.38 |
| 20 | 44.95 | 0.41 |
| 21 | 44.93 | 0.39 |
| 22 | 44.96 | 0.41 |
| 23 | 44.99 | 0.4 |
| 24 | 45 | 0.44 |
| 25 | 45.03 | 0.42 |
| 26 | 45.04 | 0.38 |
| 27 | 45.03 | 0.4 |
Answer to Problem 2.2CQ
Explanation of Solution
Given information:
Table 3
| Sample | Mean | Range |
| 1 | 45.01 | 0.85 |
| 2 | 44.99 | 0.89 |
| 3 | 45.02 | 0.86 |
| 4 | 45 | 0.91 |
| 5 | 45.04 | 0.87 |
| 6 | 44.98 | 0.9 |
| 7 | 44.91 | 0.86 |
| 8 | 45.04 | 0.89 |
| 9 | 45 | 0.85 |
| 10 | 44.97 | 0.91 |
| 11 | 45.11 | 0.84 |
| 12 | 44.96 | 0.87 |
| 13 | 45 | 0.86 |
| 14 | 44.92 | 0.89 |
| 15 | 45.06 | 0.87 |
| 16 | 44.94 | 0.86 |
| 17 | 45 | 0.85 |
| 18 | 45.03 | 0.88 |
Formula:
Mean Chart:
Difference shown by the second set of sample from the first one:
Date set:1
Table 4
| Sample | Mean | Range |
| 1 | 45.01 | 0.85 |
| 2 | 44.99 | 0.89 |
| 3 | 45.02 | 0.86 |
| 4 | 45 | 0.91 |
| 5 | 45.04 | 0.87 |
| 6 | 44.98 | 0.9 |
| 7 | 44.91 | 0.86 |
| 8 | 45.04 | 0.89 |
| 9 | 45 | 0.85 |
| 10 | 44.97 | 0.91 |
| 11 | 45.11 | 0.84 |
| 12 | 44.96 | 0.87 |
| 13 | 45 | 0.86 |
| 14 | 44.92 | 0.89 |
| 15 | 45.06 | 0.87 |
| 16 | 44.94 | 0.86 |
| 17 | 45 | 0.85 |
| 18 | 45.03 | 0.88 |
| 45 | 0.872777778 |
Excel worksheet:
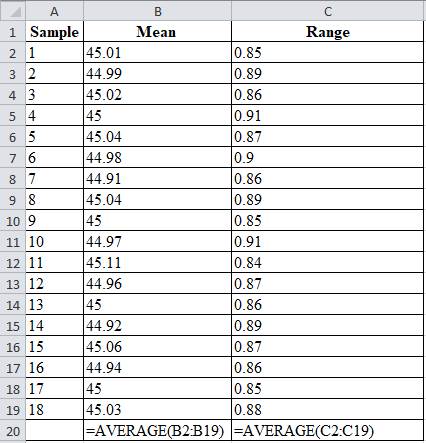
From factors of three-sigma chart, for n=20, A2 = 0.18; D3 = 0.41; D4 = 1.59
Mean control chart:
Range control chart:
Upper control limit:
The upper control limit is calculated by adding the product of 0.18 and 0.873 with 45, which yields 45.156.
Lower control limit:
The lower control limit is calculated by subtracting the product of 0.18 and 0.873 with 45, which yields 44.842.
A graph is plotted using the UCL, LCL and samples values.
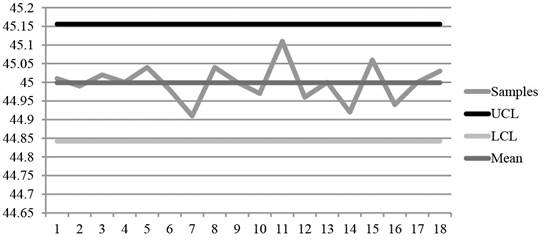
Diagram 1
Date set: 2
Table 5
| Sample | Mean | Range |
| 1 | 44.96 | 0.42 |
| 2 | 44.98 | 0.39 |
| 3 | 44.96 | 0.41 |
| 4 | 44.97 | 0.37 |
| 5 | 45.02 | 0.39 |
| 6 | 45.03 | 0.4 |
| 7 | 45.04 | 0.39 |
| 8 | 45.02 | 0.42 |
| 9 | 45.08 | 0.38 |
| 10 | 45.12 | 0.4 |
| 11 | 45.07 | 0.41 |
| 12 | 45.02 | 0.38 |
| 13 | 45.01 | 0.41 |
| 14 | 44.98 | 0.4 |
| 15 | 45 | 0.39 |
| 16 | 44.95 | 0.41 |
| 17 | 44.94 | 0.43 |
| 18 | 44.94 | 0.4 |
| 19 | 44.87 | 0.38 |
| 20 | 44.95 | 0.41 |
| 21 | 44.93 | 0.39 |
| 22 | 44.96 | 0.41 |
| 23 | 44.99 | 0.4 |
| 24 | 45 | 0.44 |
| 25 | 45.03 | 0.42 |
| 26 | 45.04 | 0.38 |
| 27 | 45.03 | 0.4 |
| 44.9959 | 0.40111 |
Excel worksheet:
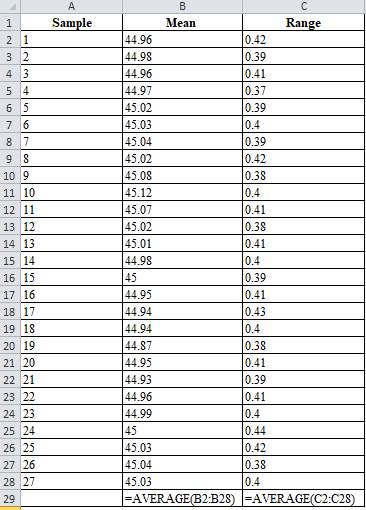
From factors of three-sigma chart, for n=20, A2 = 0.58
Mean control chart:
Range control chart:
Upper control limit:
The upper control limit is calculated by adding the product of 0.58 and 0.401 with 44.99, which yields 45.229.
Lower control limit:
The lower control limit is calculated by subtracting the product of 0.58 and 0.401 with 44.99, which yields 44.763.
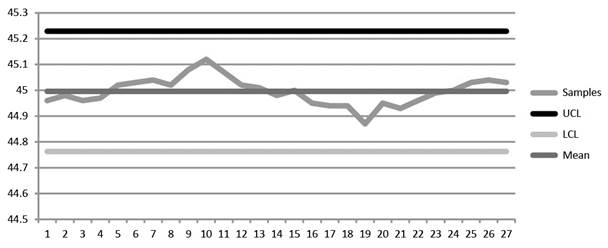
Diagram 2
On comparing Diagrams 1 and 2, it is evident that the second set of data has closer range of changes while the first set of data is scattered and reveals no information about the changes in the process.
Hence, the second sample reveals the changes in the process changes more clearly than the first set of data.
Want to see more full solutions like this?
Chapter 10 Solutions
OPERATIONS MGMT.-W/CONNECT (LL)>CUSTOM<


- In a fabric manufacturing factory, the quality contral process using control charts from SPC. In an hour there are a total of 5 samples are taken each having 4 observations regarding the thickness of fabric in measured in millimeters. In a particular hour, the sample means (X-bar) are noted to be: 156.46, 199.62, 189.31, 102.22, and112.09 respectively. In the same sample, the corresponding ranges are: 11.97, 12.17, 13.94, 11.86, and 11.83 respectively. What are the lower and upper control limits for the X-bar chart?arrow_forwardA process considered to be in control measures an ingredient in ounces. Roberto Baggio, a quality inspector took 20 samples, each with 8 observations as follows: thats in the pictuer after that using this information, obtain three-sigma (i.e., z=3) control limits for a mean control chart and control limits for a range chart, respectively. It is known from previous experience that the standard deviation of the process is 0.693. First: perform all actions and calculations needed to answer the question. All equations/calculations needed to be fully written STEP by STEP. No short calculations or direct answers/results will be accepted. This applies to the calculations for both types of control limits (mean and range). Second: Explain the process followed to identify each type of control limit and any observations made in the problem-solving process. thank you very mucharrow_forwardMcDaniel Shipyards wants to develop control charts to assess the quality of its steel plate. They take ten sheets of 1" steel plate and compute the number of cosmetic flaws on each roll. Each sheet is 20' by 100'. Based on the following data, develop limits for the control chart, plot the control chart, and determine whether the process is in control. Sheet Number of flaws 1 1 2 1 3 2 4 0 5 1 6 5 7 0 8 2 9 0 10 2arrow_forward
- Studies on a machine that molds plastic water pipe indicate that when it is injecting1-inch diameter pipe, the process standard deviation is 0.05 inches. The one-inchpipe has a specification of 1-inch plus or minus 0.10 inch. What is the processcapability index (Cp) if the long-run process mean is 1 inch?arrow_forwardA manager wishes to build a control chart for a process. A total of five () samples are collected with six (06) observations within each sample. The sample means (X-bar) are15.36, 14.61, 16.36, 20.28 , and 15.77 respectively. Also, the corresponding ranges are 0.79, 8.37, 4.81, 8.17 and 3.31 respectively. The lower and upper control limits of the x-bar chart are respectively aNone is correct b. 18.5513.47 , 11.47 d. 12.60.20.36 13.07 , 19.88arrow_forwardTwelve samples, each containing five parts, were takenfrom a process that produces steel rods at Emmanuel Kodzi’sfactory. The length of each rod in the samples was determined.The results were tabulated and sample means and ranges werecomputed. The results were: a) Determine the upper and lower control limits and the overallmeans for x -charts and R -charts.b) Draw the charts and plot the values of the sample means andranges.c) Do the data indicate a process that is in control?d) Why or why not?arrow_forward
- The specification limits for a product are 9.9 cm and 12.35 cm. A process that produces the product has a mean of 11.18 cm and a standard deviation of 0.52 cm. What is the process capability, Cpk? a. 0.8205 b. 1.571 c. 0.7853 d. 0.75arrow_forwardIf a process is neither capable nor in control, which of the following is the first step to be taken? 1) Redesign the equipment 2) Remove sources of special causes of variation 3) Determine the process capability index 4) Remove common causes of variationarrow_forwardWhat trade-offs are involved in each of these decisions?a. Deciding whether to use two-sigma or three-sigma control limits.b. Choosing between a large sample size and a smaller sample size.c. Trying to increase the capability of a process that is barely capable.arrow_forward
- In a fabric manufacturing factory, the quality control process using control charts from SPC. In an hour there are a total of 5 samples are taken each having 5 observations regarding the thickness of fabric in measured in millimeters In a particular hour, the sample means (X-bar) are noted to be: 172.11, 219.58, 208.24, 112.44, and 123.30 respectively. In the same sample, the corresponding ranges are: 13.17, 3.38, 15.34, 13.0 , and 13.02 respectively What are the lower and upper control limits for the X-bar chart? a . 157.21 , 177.05 b. 146.01, 157.87 c. 159.25, 175.02 d. 142.92, 160.66 e. 143.55, 165.47 f. None is correctarrow_forward3 cases that arise regarding relationship between the process capability limits (or natural tolerance limitsand the specification limits.arrow_forwardYour supervisor, Lisa Lehmann, has asked that you report on the output of a machine on the factory floor. This machine is supposed to be producing optical lenses with a meanweight of 50 grams and a range of 3.5 grams. The following table contains the data for a sample size of n = 6 taken during the past 3 hours: a) What are the :X-chart control limits when the machine is working properly?b) What are the R-charL control limits when the machine is working properly?c) What seems to be happening? (Hint: Graph the data points. Run charts may be helpful.)arrow_forward
 Practical Management ScienceOperations ManagementISBN:9781337406659Author:WINSTON, Wayne L.Publisher:Cengage,
 Operations ManagementOperations ManagementISBN:9781259667473Author:William J StevensonPublisher:McGraw-Hill Education
 Operations and Supply Chain Management (Mcgraw-hi...Operations ManagementISBN:9781259666100Author:F. Robert Jacobs, Richard B ChasePublisher:McGraw-Hill Education
 Purchasing and Supply Chain ManagementOperations ManagementISBN:9781285869681Author:Robert M. Monczka, Robert B. Handfield, Larry C. Giunipero, James L. PattersonPublisher:Cengage Learning
 Production and Operations Analysis, Seventh Editi...Operations ManagementISBN:9781478623069Author:Steven Nahmias, Tava Lennon OlsenPublisher:Waveland Press, Inc.