
Videos
a)
To determine: The probability of earning more than 10 percent on long-term corporate bonds.
Introduction:
The
Standard deviation refers to the variation in the actual observations from the average.
Z-Score helps to know how many numbers of standard deviations is the raw score or outcome away from the average or mean.
a)
Answer to Problem 28QP
The probability of earning more than 10 percent on long-term corporate bonds is 33.41 percent.
Explanation of Solution
Given information:
Assume that the returns of long-term corporate bonds have a normal distribution. The average return or mean of long-term corporate bonds is 6.4 percent, and the standard deviation is 8.4 percent (Refer to Figure 10.10 in the text).
Determine the probability of having a return greater than 10 percent on long-term government bonds:
Follow the common steps from Step 1 to Step 3 given below. Then, proceed with the Step 4.
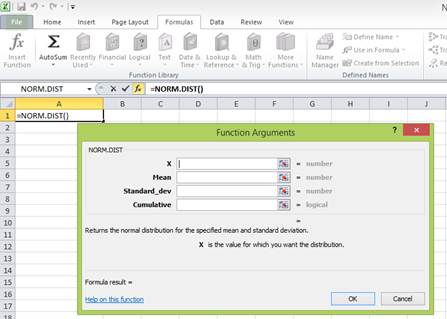
The common steps to be followed to use the “NORM.DIST” function in Excel:
Step 1:
Open an Excel worksheet.
Step 2:
Place the cursor in cell A1.

Step 3:
Select the “Formulas” tab, and go to “More functions” in the ribbon. Under “More functions”, select “Statistical”. Under the drop-down menu of “Statistical”, select “NORM.DIST” function.
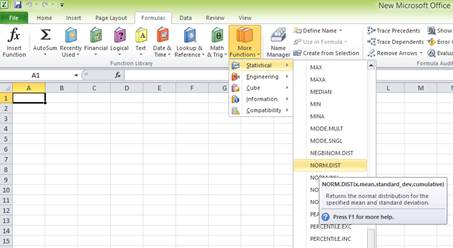
After clicking the “NORM.DIST” function, a popup window named “Function arguments” appears.

Step 4:
Enter the values. “X” represents the raw score or outcome. Here, it is necessary to test the probability of having more than 10 percent returns. Hence, “X” equals 10 percent. The mean or average return is 6.4 percent. The standard deviation is 8.4 percent. The cumulative distribution function provides the probability of the area to the left of Z. Hence, enter “TRUE” in the “Cumulative” column.
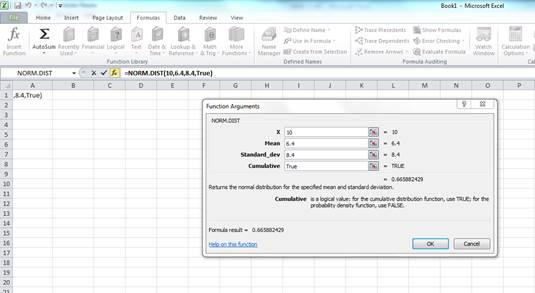
Press “OK” after providing the inputs. The probability of the area to the left of Z is as follows:
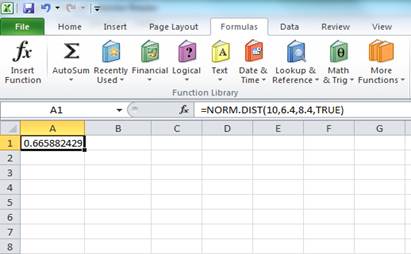
The probability of 0.665882 represents the area to the left of Z. The area to the left of Z is the probability of getting less than 10 percent return. The area to the right of Z is the probability of getting a return of 10 percent or more.
The total area represented by the normal distribution curve has a probability of “1”. The area to the left of Z has a probability of 0.665882. Hence, the probability of the area to the right of Z is “1” minus the probability of the area to the left of Z. Hence, the probability of getting 10 percent return or more is 0.334118 or 33.4118 percent
To determine: The probability of earning less than 0 percent on long-term corporate bonds
Answer to Problem 28QP
The probability of earning less than 0 percent on long-term corporate bonds is 0.223058 or 0.223058 percent
Explanation of Solution
Given information:
Assume that the returns of long-term corporate bonds have a normal distribution. The average return or mean of long-term corporate bonds is 6.4 percent, and the standard deviation is 8.4 percent (Refer to Figure 10.10 in the text).
Determine the probability of having a return less than 0 percent on long-term government bonds:
Follow the common steps from Step 1 to Step 3 given below. Then, proceed with the Step 4.
The common steps to be followed to use the “NORM.DIST” function in Excel:
Step 1:
Open an Excel worksheet.
Step 2:
Place the cursor in cell A1.

Step 3:
Select the “Formulas” tab, and go to “More functions” in the ribbon. Under “More functions”, select “Statistical”. Under the drop-down menu of “Statistical”, select “NORM.DIST” function.

After clicking the “NORM.DIST” function, a popup window named “Function arguments” appears.

Step 4:
Enter the values. “X” represents the raw score or outcome. Here, it is necessary to test the probability of having (0 percent) return or less. Hence, “X” equals (0 percent). The mean or average return is 6.4 percent. The standard deviation is 8.4 percent. The cumulative distribution function provides the probability of the area to the left of Z. Hence, enter “TRUE” in the “Cumulative” column.
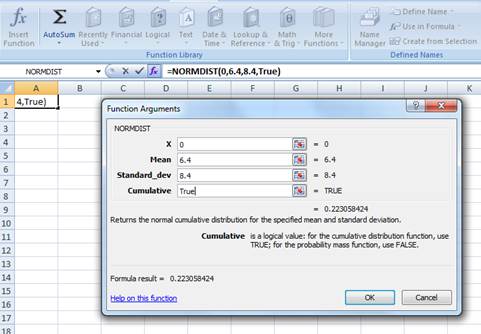
Press “OK” after providing the inputs. The probability of the area to the left of Z is as follows:
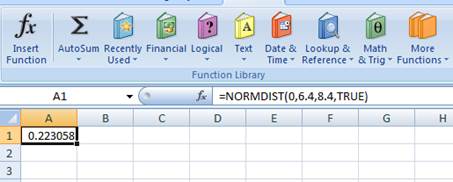
The probability of 0.223058 represents the area to the left of Z. The area to the left of Z refers to the probability of getting (0 percent) return or less because the left-hand side of the normal distribution curve indicates negative returns. Hence, the probability of earning less than 0 percent is 0.223058 or 0.223058 percent.
b)
To determine: The probability of earning more than 10 percent on Treasury bills
b)
Answer to Problem 28QP
The probability of earning more than 10 percent on Treasury bills is 0.018006785 or 1.80 percent.
Explanation of Solution
Given information:
Assume that the returns of Treasury bills have a normal distribution. The average return or mean of Treasury bills is 3.5 percent, and the standard deviation is 3.1 percent (Refer to Figure 10.10 in the textbook).
Determine the probability of having a return greater than 10 percent on Treasury bills:
Follow the common steps from Step 1 to Step 3 given below. Then, proceed with the Step 4.
The common steps to be followed to use the “NORM.DIST” function in Excel:
Step 1:
Open an Excel worksheet.
Step 2:
Place the cursor in cell A1.
Step 3:
Select the “Formulas” tab, and go to “More functions” in the ribbon. Under “More functions”, select “Statistical”. Under the drop-down menu of “Statistical”, select “NORM.DIST” function.

After clicking the “NORM.DIST” function, a popup window named “Function arguments” appears.

Step 4:
Enter the values. “X” represents the raw score or outcome. Here, it is necessary to test the probability of having more than 10 percent returns. Hence, “X” equals 10 percent. The mean or average return is 3.5 percent. The standard deviation is 3.1 percent. The cumulative distribution function provides the probability of the area to the left of Z. Hence, enter “TRUE” in the “Cumulative” column.
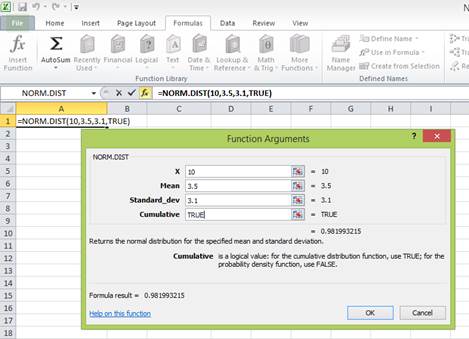
Press “OK” after providing the inputs. The probability of the area to the left of Z is as follows:
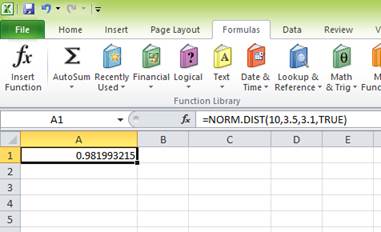
The probability of 0.981993215 represents the area to the left of Z. The area to the left of Z is the probability of getting less than 10 percent return. The area to the right of Z is the probability of getting a return of 10 percent or more.
The total area represented by the normal distribution curve has a probability of “1”. The area to the left of Z has a probability of 0.981993215. Hence, the probability of the area to the right of Z is “1” minus the probability of the area to the left of Z. Hence, the probability of getting 10 percent return or more is 0.018006785 or 1.80 percent
To determine: The probability of earning less than 0 percent on Treasury bills.
Answer to Problem 28QP
The probability of earning less than 0 percent on Treasury bills is 0.129442113 or 12.94 percent.
Explanation of Solution
Given information:
Assume that the returns of Treasury bills have a normal distribution. The average return or mean of Treasury bills is 3.5 percent, and the standard deviation is 3.1 percent (Refer to Figure 10.10 in the text).
Determine the probability of having a return less than 0 percent on Treasury bills:
Follow the common steps from Step 1 to Step 3 given below. Then, proceed with the Step 4.
The common steps to be followed to use the “NORM.DIST” function in Excel:
Step 1:
Open an Excel worksheet.
Step 2:
Place the cursor in cell A1.

Step 3:
Select the “Formulas” tab, and go to “More functions” in the ribbon. Under “More functions”, select “Statistical”. Under the drop-down menu of “Statistical”, select “NORM.DIST” function.
After clicking the “NORM.DIST” function, a popup window named “Function arguments” appears.

Step 4:
Enter the values. “X” represents the raw score or outcome. Here, it is necessary to test the probability of having (0 percent) return or less. Hence, “X” equals (0 percent). The mean or average return is 3.5 percent. The standard deviation is 3.1 percent. The cumulative distribution function provides the probability of the area to the left of Z. Hence, enter “TRUE” in the “Cumulative” column.
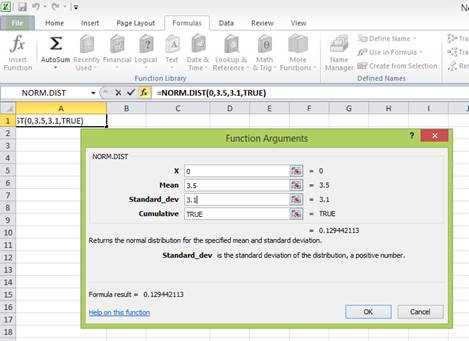
Press “OK” after providing the inputs. The probability of the area to the left of Z is as follows:
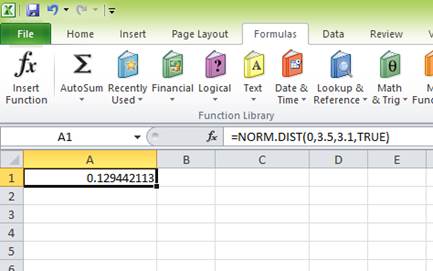
The probability of 0.129442113 represents the area to the left of Z. The area to the left of Z refers to the probability of getting (0 percent) return or less because the left-hand side of the normal distribution curve indicates negative returns. Hence, the probability of earning less than 0 percent is 0.129442113 or 12.94 percent.
c)
To determine: The probability of earning (4.18 percent) on long-term corporate bonds.
c)
Answer to Problem 28QP
The probability of earning (4.18 percent) on long-term corporate bonds is 0.1039 or 10.39 percent.
Explanation of Solution
Given information:
Assume that the returns of long-term corporate bonds have a normal distribution. The average return or mean of long-term corporate bonds is 6.4 percent, and the standard deviation is 8.4 percent (Refer to Figure 10.10 in the textbook).
Determine the probability of having (4.18 percent) on long-term government bonds:
Follow the common steps from Step 1 to Step 3 given below. Then, proceed with the Step 4.
The common steps to be followed to use the “NORM.DIST” function in Excel:
Step 1:
Open an Excel worksheet.
Step 2:
Place the cursor in cell A1.

Step 3:
Select the “Formulas” tab, and go to “More functions” in the ribbon. Under “More functions”, select “Statistical”. Under the drop-down menu of “Statistical”, select “NORM.DIST” function.
After clicking the “NORM.DIST” function, a popup window named “Function arguments” appears.
Step 4:
Enter the values. “X” represents the raw score or outcome. Here, it is necessary to test the probability of having (4.18 percent) return or less. Hence, “X” equals (4.18 percent). The mean or average return is 6.4 percent. The standard deviation is 8.4 percent. The cumulative distribution function provides the probability of the area to the left of Z. Hence, enter “TRUE” in the “Cumulative” column.
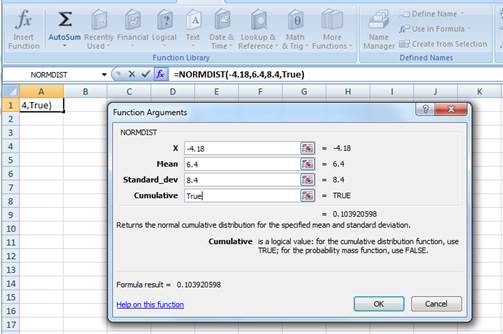
Press “OK” after providing the inputs. The probability of the area to the left of Z is as follows:
The probability of 0.103921 represents the area to the left of Z. The area to the left of Z refers to the probability of getting (4.18 percent) return or less because the left-hand side of the normal distribution curve indicates negative returns. Hence, the probability of earning (4.18 percent) is 0.1039 or 10.39 percent.
To determine: The probability of earning 10.56 percent on Treasury bills.
Answer to Problem 28QP
The probability of earning 10.56 percent on Treasury bills is 0.011380598 or 1.14 percent
Explanation of Solution
Given information:
Assume that the returns of Treasury bills have a normal distribution. The average return or mean of Treasury bills is 3.5 percent, and the standard deviation is 3.1 percent (Refer to Figure 10.10 in the text).
Determine the probability of having a return of 10.56 percent on Treasury bills:
Follow the common steps from Step 1 to Step 3 given below. Then, proceed with the Step 4.
The common steps to be followed to use the “NORM.DIST” function in Excel:
Step 1:
Open an Excel worksheet.
Step 2:
Place the cursor in cell A1.

Step 3:
Select the “Formulas” tab, and go to “More functions” in the ribbon. Under “More functions”, select “Statistical”. Under the drop-down menu of “Statistical”, select “NORM.DIST” function.
After clicking the “NORM.DIST” function, a popup window named “Function arguments” appears.
Step 4:
Enter the values. “X” represents the raw score or outcome. Here, it is necessary to test the probability of having 10.56 percent returns. Hence, “X” equals 10.56 percent. The mean or average return is 3.5 percent. The standard deviation is 3.1 percent. The cumulative distribution function provides the probability of the area to the left of Z. Hence, enter “TRUE” in the “Cumulative” column.
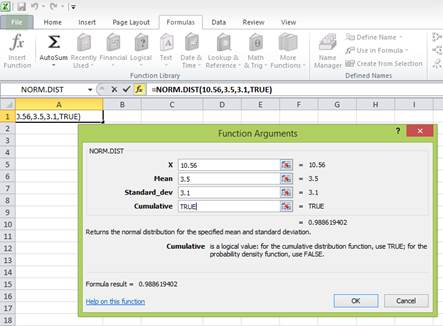
Press “OK” after providing the inputs. The probability of the area to the left of Z is as follows:
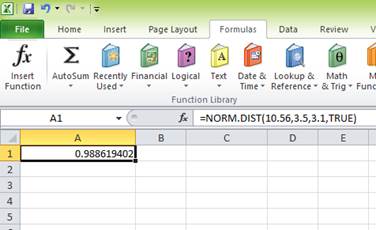
The probability of 0.988619402 represents the area to the left of Z. The area to the left of Z is the probability of getting less than 10.56 percent return. The area to the right of Z is the probability of getting a return of 10.56 percent or more.
The total area represented by the normal distribution curve has a probability of “1”. The area to the left of Z has a probability of 0.988619402. Hence, the probability of the area to the right of Z is “1” minus the probability of the area to the left of Z. Hence, the probability of getting 10.56 percent return or more is 0.011380598 or 1.14 percent
Want to see more full solutions like this?
Chapter 10 Solutions
ESSEN.OF CORP.FINANCE-W/ACCESS


- What is the stand-alone risk? Use the scenario data to calculate the standard deviation of the bonds return for the next year.arrow_forwardUse the extended DuPont equation to provide a breakdown of Computrons projected return on equity. How does the projection compare with the previous years and with the industrys DuPont equation?arrow_forwardPlease include the excel formula You’ve observed the following returns on Pine Computer’s stock over the past five years: 8 percent, −12 percent, 14 percent, 21 percent, and 16 percent. Suppose the average inflation rate over this period was 3.1 percent and the average T-bill rate over the period was 3.9 percent. What was the average real return on the company’s stock? What was the average nominal risk premium on the company’s stock over this period? Input area: Year Returns 1 8% 2 -12% 3 14% 4 21% 5 16% Average inflation 3.10% Average T-bill rate 3.90% (Use cells A6 to B13 from the given information to complete this question. You must use the built-in Excel function to answer this question. Make sure to use the “sample” Excel formula.)…arrow_forward
- Bond valuation related problems should be solved by using a financial calculator or MS excel spreadsheet. Accordingly, you must show the values of all relevant time valu of money variables If D1 = $1.50 g (which is constant) = 6.5%, Po = $56, what is the stock's expected capital gains yield for the coming year?arrow_forwardBond valuation related problems should be solved by using a financial calculator or MS excel spreadsheet. Accordingly, you must show the values of all relevant time valu of money variables If D1 = $1.25, g(which is constant) = 4.7%, and Po= $26.00 what is the stocks expected dividend yield for the coming year?arrow_forwardIn historical data, we see that investments with the highest average annual returns also tend to have the highest standard deviations of annual returns. This observation supports the notion that there is a positive correlation between risk and return. Which of the following answers correctly ranks investments from highest to lowest risk (and return), where the security with the highest risk is shown first, the one with the lowest risk last? a. Large-company stocks, small-company stocks, long-term corporate bonds, U.S. Treasury bills, long-term government bonds. b. Small-company stocks, large-company stocks, long-term corporate bonds, long-term government bonds, U.S. Treasury bills. c. U.S. Treasury bills, long-term government bonds, long-term corporate bonds, small-company stocks, large-company stocks. d. Large-company stocks, small-company stocks, long-term corporate bonds, long-term government bonds, U.S. Treasury bills. e. Small-company stocks, long-term corporate bonds,…arrow_forward
- You’ve observed the following returns on SkyNet Data Corporation’s stock over the past five years: 19 percent, 24 percent, 11 percent, −9 percent, and 13 percent. Suppose the average inflation rate over this period was 3.6 percent and the average T-bill rate over the period was 4.1 percent.a. What was the average real return on the company’s stock?b. What was the average nominal risk premium on the company’s stock?arrow_forwarda. Given the following holding-period returns, (Below)compute the average returns and the standard deviations for the Sugita Corporation and for the market. b. If Sugita's beta is 1.18and the risk-free rate is 4 percent, what would be an expected return for an investor owning Sugita? (Note: Because the preceding returns are based on monthly data, you will need to annualize the returns to make them comparable with the risk-free rate. For simplicity, you can convert from monthly to yearly returns by multiplying the average monthly returns by 12.) c. How does Sugita's historical average return compare with the return you should expect based on the Capital Asset Pricing Model and the firm's systematic risk?arrow_forwardAssume the average return on utility stocks was 8.9% over the past 40 years. �If the average return on Treasury bills was 3.8% over that period, what is the historical risk premium for utility stocks?arrow_forward
- Use the data in the tables below to answer the following questions: Average rates of return on Treasury bills, government bonds, and common stocks, 1900–2020. Portfolio Average Annual Rate of Return (%) Average Premium (Extra return versus Treasury bills) (%) Treasury bills 3.7 Treasury bonds 5.4 1.7 Common stocks 11.5 7.8 Standard deviation of returns, 1900–2020. Portfolio Standard Deviation (%) Treasury bills 2.8 Long-term government bonds 8.9 Common stocks 19.5 What was the average rate of return on large U.S. common stocks from 1900 to 2020? What was the average risk premium on large stocks? What was the standard deviation of returns on common stocks? Note: Enter your answer as a percent rounded to 1 decimal place.arrow_forwardIn an economy where the risk-free interest rate is 19% and the expected return of the market is 25%, the beta coefficients of A, B, C and D stocks and the expected returns announced by the companies are as follows. According to the Financial (Capital) Assets Pricing Model c) Calculate the expected return rates of the shares.d) Determine which stocks can be invested by comparing the expected return announced by the company with the expected return you calculated.arrow_forwardYou’ve observed the following returns on Crash-n-Burn Computer’s stock over the past five years: 14 percent, –9 percent, 16 percent, 21 percent, and 3 percent. Suppose the average inflation rate over this period was 3.5 percent and the average T-bill rate over the period was 4.2 percent. a. What was the average real return on the company’s stock? b. What was the average nominal risk premium on the company’s stock?arrow_forward
 EBK CONTEMPORARY FINANCIAL MANAGEMENTFinanceISBN:9781337514835Author:MOYERPublisher:CENGAGE LEARNING - CONSIGNMENT

 Intermediate Financial Management (MindTap Course...FinanceISBN:9781337395083Author:Eugene F. Brigham, Phillip R. DavesPublisher:Cengage Learning