
(a)
The aggregate demand curve.
(a)
Explanation of Solution
Figure 1 shows the aggregate demand and
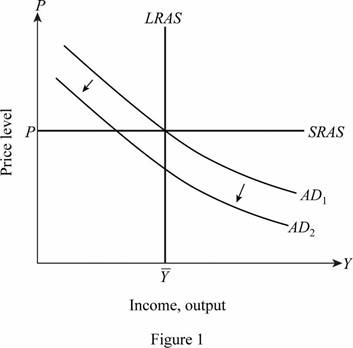
The horizontal axis of Figure 1 measures the income and output, and the vertical axis measures the price level. The aggregate demand curve, AD1, is the initial aggregate demand curve. The horizontal curve SRAS parallel to the output axis is the short-run supply curve, and the vertical curve LRAS is the long run
Here, M is the money supply, V is the velocity of money, P is the price level, and Y is the output. This relationship clearly points that a decrease in the money supply would lead to a proportionate decrease in the nominal output. Thus, when the value of velocity of money is given for a particular level of output, a reduction in the money supply would lead to a reduction in the price level.
Quantity theory of money: Quantity theory of money refers to the relationship between the price level and money supply. The quantity theory of money equation is
(b)
The change in output and price levels.
(b)
Explanation of Solution
Figure 2 shows the aggregate demand and aggregate supply curves in the long run.
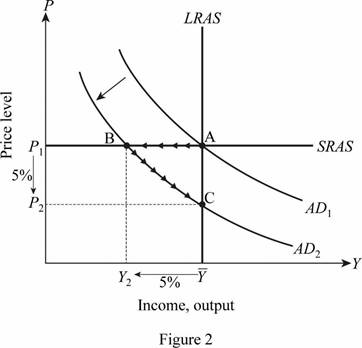
The horizontal axis of Figure 2 measures the income and output, and the vertical axis measures the price level. The aggregate demand curve, AD1, is the initial aggregate demand curve. The horizontal curve SRAS parallel to the output axis is the short-run supply curve, and the vertical curve LRAS is the long-run aggregate supply curve. It is known that the price level is fixed in the short run, which is indicated by the horizontal aggregate supply curve. When the money supply reduces, the aggregate demand curve shifts from AD1 to AD2, leading to a movement from point A to point B. This movement implies that the level of output reduces, while the price remains constant. However, in the long run, the prices are also variable, and hence the price reduces, and the economy restores full employment at the point C.
It is known that quantity theory of money is given by Equation (1) as follows:
Let one assume that the velocity is constant, and the percentage reduction in money supply is 5%.
The quantity equation can be expressed in percentage terms using Equation (2) as follows:
In the short run, the price level is constant; thus, the change in price level is zero, and the change in velocity is also 0. Substituting the respective values in Equation (2), the percentage change in output can be calculated as follows:
Thus, the percentage change in the level of output is equal to the percentage change in the money supply, which is 5%.
Thus, a 5 % reduction in the money supply leads to a 5 % reduction in the quantity of output in the short run.
In the long run, the output level is restored as the price level is flexible. Thus, the change in output in the long run is zero. The change in the price level in the long run can be calculated as follows:
Thus, a 5% reduction in the money supply would lead to a 5% reduction in the price level in the long run.
Quantity theory of money: Quantity theory of money refers to the relationship between the price level and money supply. The quantity theory of money equation is
(c)
The level of
(c)
Explanation of Solution
It is known that Okun’s law is the mathematical relationship between unemployment and real
In the short run, the reduction in the level of output reduces the rate of employment, and hence, the rate of unemployment increases. It is known that the output reduces by 55 in the short run. The rate of unemployemnt can be calculated by substituting the respective values in Equation (3) as follows:
Thus, a 5% reduction in the output in the short run leads to an increase in the rate of unemployment by 4%. However, in the long run, the level of output and employment is restored, and hence the rate of unemployment in the long run remains unchanged.
Unemployment rate: Unemployment rate refers to the percentage of unemployed people in the labor force. Unemployment is a state that occurs in an economy when the able and willing persons cannot find any work or job. But, these people are keenly seeking for jobs.
(d)
The rate of interest.
(d)
Explanation of Solution
Figure 3 shows the changes in the interest rate.
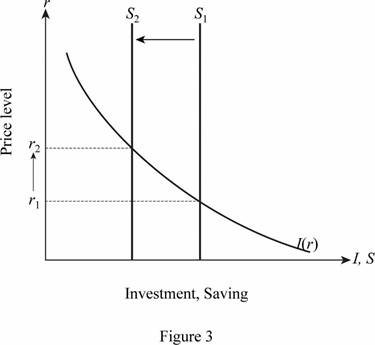
The horizontal axis of Figure 3 measures the investment and saving, and the vertical axis measures the real interest rate. The downward doping curve I indicates the interest rate.
The vertical curve S1 is the initial money supply curve. It is known that the savings is the difference between the total income and consumption. If the national savings are concerned, it is the difference between the total income, consumption, and the Government expenditure. A reduction in the total income would lead to a reduction in the national savings. This implies that the money supply reduces from S1 to S2. The reduction in the supply of money leads to an increase in the rate of interest from r1 to r2. In the long run, since the level of output is restored, the interest rate also falls back to r1.
Short run: Short run is defined as the period in which production can be increased only by varying one of the input factors, and the others remain fixed.
Long run: Long run is defined as the period in which production can be increased by changing all the input factors.
Savings: Saving is a portion of disposable income that is left over after consumption. National savings include private savings and government savings.
Want to see more full solutions like this?
Chapter 10 Solutions
MACROECONOMICS+SAPLING+6 M REEF HC>IC<

 Brief Principles of Macroeconomics (MindTap Cours...EconomicsISBN:9781337091985Author:N. Gregory MankiwPublisher:Cengage Learning
 Principles of Economics (MindTap Course List)EconomicsISBN:9781305585126Author:N. Gregory MankiwPublisher:Cengage Learning
 Principles of Economics, 7th Edition (MindTap Cou...EconomicsISBN:9781285165875Author:N. Gregory MankiwPublisher:Cengage Learning
 Principles of Macroeconomics (MindTap Course List)EconomicsISBN:9781305971509Author:N. Gregory MankiwPublisher:Cengage Learning
 Principles of Macroeconomics (MindTap Course List)EconomicsISBN:9781285165912Author:N. Gregory MankiwPublisher:Cengage Learning
 Economics (MindTap Course List)EconomicsISBN:9781337617383Author:Roger A. ArnoldPublisher:Cengage Learning