Statistics for Business & Economics, Revised (MindTap Course List)
12th Edition
ISBN: 9781285846323
Author: David R. Anderson, Dennis J. Sweeney, Thomas A. Williams, Jeffrey D. Camm, James J. Cochran
Publisher: South-Western College Pub
bartleby

Videos

Question
Book Icon
Chapter 10, Problem 47SE

a.

To determine

Find a 95% confidence interval for the difference between the bullish sentiment measures for the most recent two weeks.

a.

Expert Solution
Check Mark

Answer to Problem 47SE

The 95% confidence interval for the difference between the bullish sentiment measures for the most recent two weeks is (0.297,0.127).

Explanation of Solution

Calculation:

It is given that the bullish sentiment of individual investors for the week end was 27.6%, 48.7% for one week earlier and 39.7% for one month earlier. A sample of 240 is considered.

Confidence interval:

The interval estimate of the difference between two population proportions is,

Confidence interval=p¯1p¯2±zα2p¯1(1p¯1)n1+p¯2(1p¯2)n2

where 1α is the confidence coefficient, p¯1and p¯2 the point estimates for population proportion, n1and n2 are sample sizes for the two group..

Here, n1=n2=n3=240,p¯1=0.276,p¯2=0.487,p¯3=0.397,  and

x1=(240)(0.276)=66.2466

x2=(240)(0.487)=116.88117

x3=(240)(0.397)=95.2895

Software procedure:

Step-by-step software procedure to obtain the p-value using MINITAB software is as follows,

  • Choose Stat > Basic Statistics > 2 Proportions.
  • Choose Summarized data.
  • In First sample, enter Trials (n) as 240 and Events as (x) 66.
  • In Second sample, enter Trials (n) as 240 and Events as 117.
  • Click Options.
  • In Confidence level, Enter 95.
  • In Alternative select not equal.
  • Click OK in all dialogue boxes.

Output using MINITAB software is as follows,

Statistics for Business & Economics, Revised (MindTap Course List), Chapter 10, Problem 47SE , additional homework tip  1

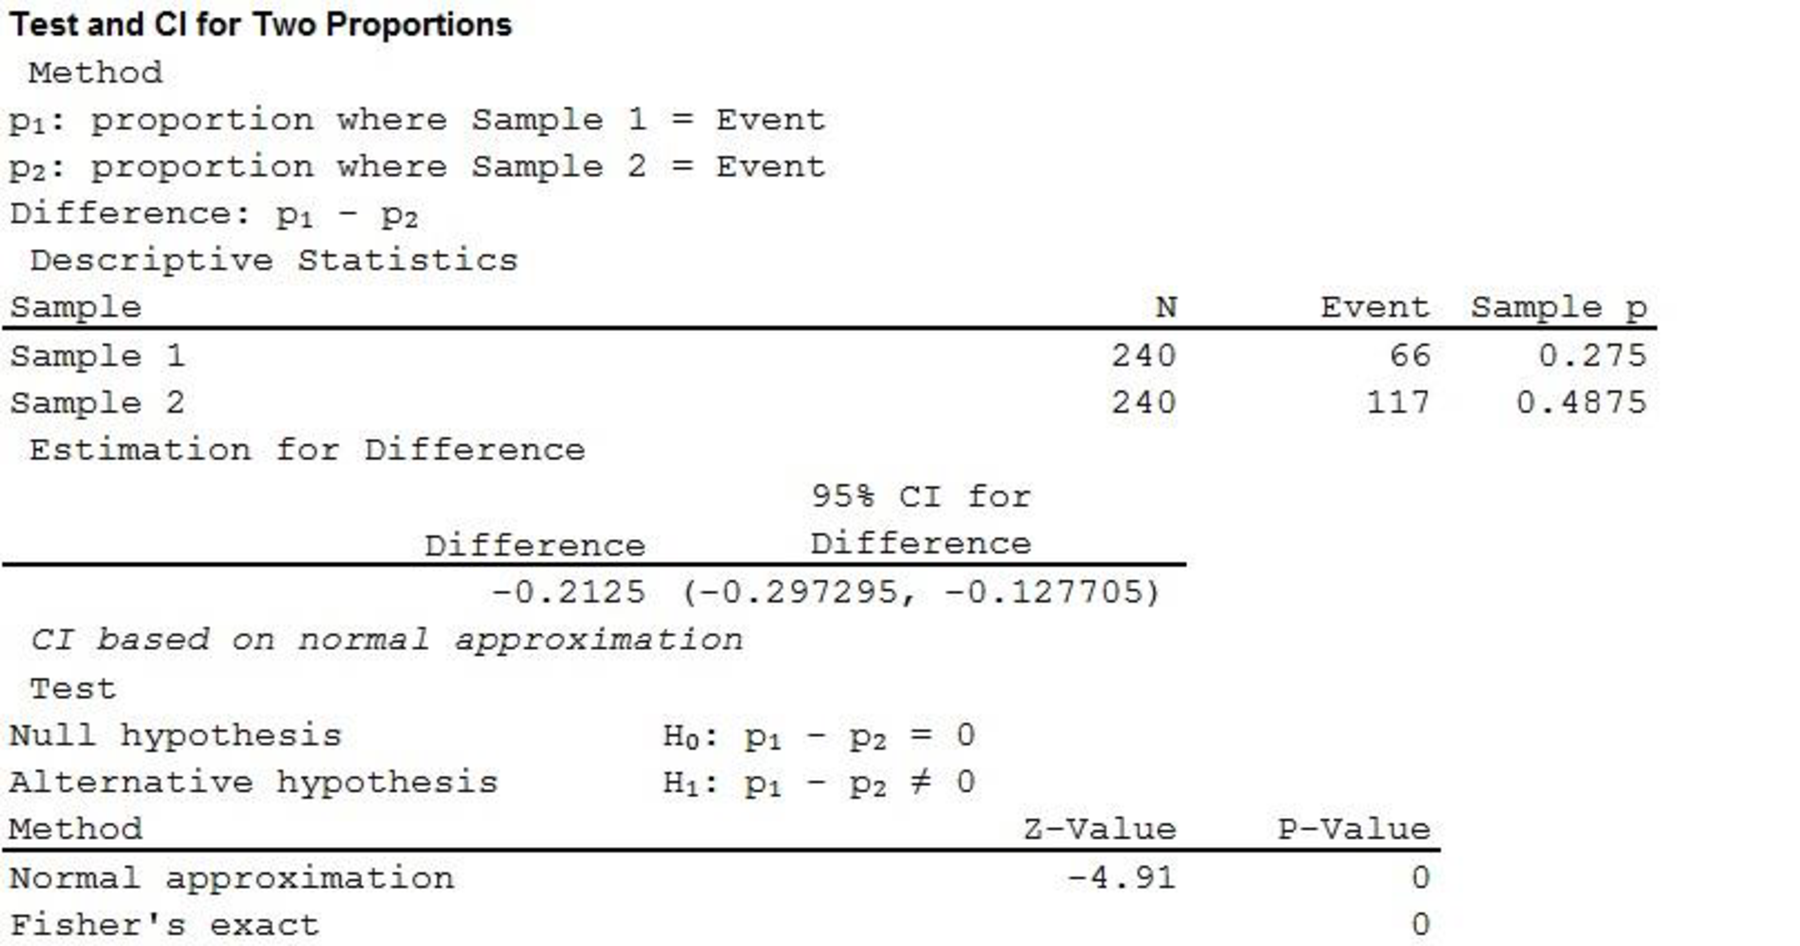
Thus, the 95% confidence interval is (0.297,0.127).

Interpretation:

There is 95% confidence that the difference between the bullish sentiment measures for the most recent two weeks lies between –0.297 and –0.127.

b.

To determine

State the null and alternative hypothesis so that rejection of the null hypothesis will allow to conclude that the most recent bullish sentiment is weaker than that of one month ago.

b.

Expert Solution
Check Mark

Answer to Problem 47SE

The null and alternative hypotheses are given below:

Null hypothesis: H0:p1p30

Alternative hypothesis: Ha:p1p3<0

Explanation of Solution

Calculation:

Here p1 represents the proportion of the bullish sentiment of individual investors for the most recent week and p3 represents the proportion of the bullish sentiment of individual investors for one month ago.

State the hypothesis:

The test hypotheses are as follows,

Null hypothesis:

H0:p1p30

That is, the proportion of the bullish sentiment of individual investors for the most recent week is greater than the proportion of the bullish sentiment of individual investors for one month ago.

Alternative hypothesis:

Ha:p1p3<0

That is, the proportion of the bullish sentiment of individual investors for the most recent week is less than the proportion of the bullish sentiment of individual investors for one month ago.

c.

To determine

Test the hypothesis in part (b) at α=0.01 and make a conclusion.

c.

Expert Solution
Check Mark

Answer to Problem 47SE

There is sufficient evidence to conclude that, there is decrease in bullish sentiment over the past month.

Explanation of Solution

Calculation:

Test statistic:

The test statistic for hypothesis tests about p1p3 is,

z=(p¯1p¯3)p¯(1p¯)(1n1+1n2)

Where p¯1and p¯2 the point estimates for population proportion, n1and n2 are sample sizes for the two groups, and p¯ is the pooled proportion

Software procedure:

Step-by-step software procedure to obtain the p-value using MINITAB software is as follows,

  • Choose Stat > Basic Statistics > 2 Proportions.
  • Choose Summarized data.
  • In First sample, enter Trials (n) as 240 and Events as (x) 66.
  • In Second sample, enter Trials (n) as 240 and Events as 95.
  • Click Options.
  • In Confidence level, Enter 99.
  • In Alternative select less than.
  • Click OK in all dialogue boxes.

Output using MINITAB software is as follows,

Statistics for Business & Economics, Revised (MindTap Course List), Chapter 10, Problem 47SE , additional homework tip  2

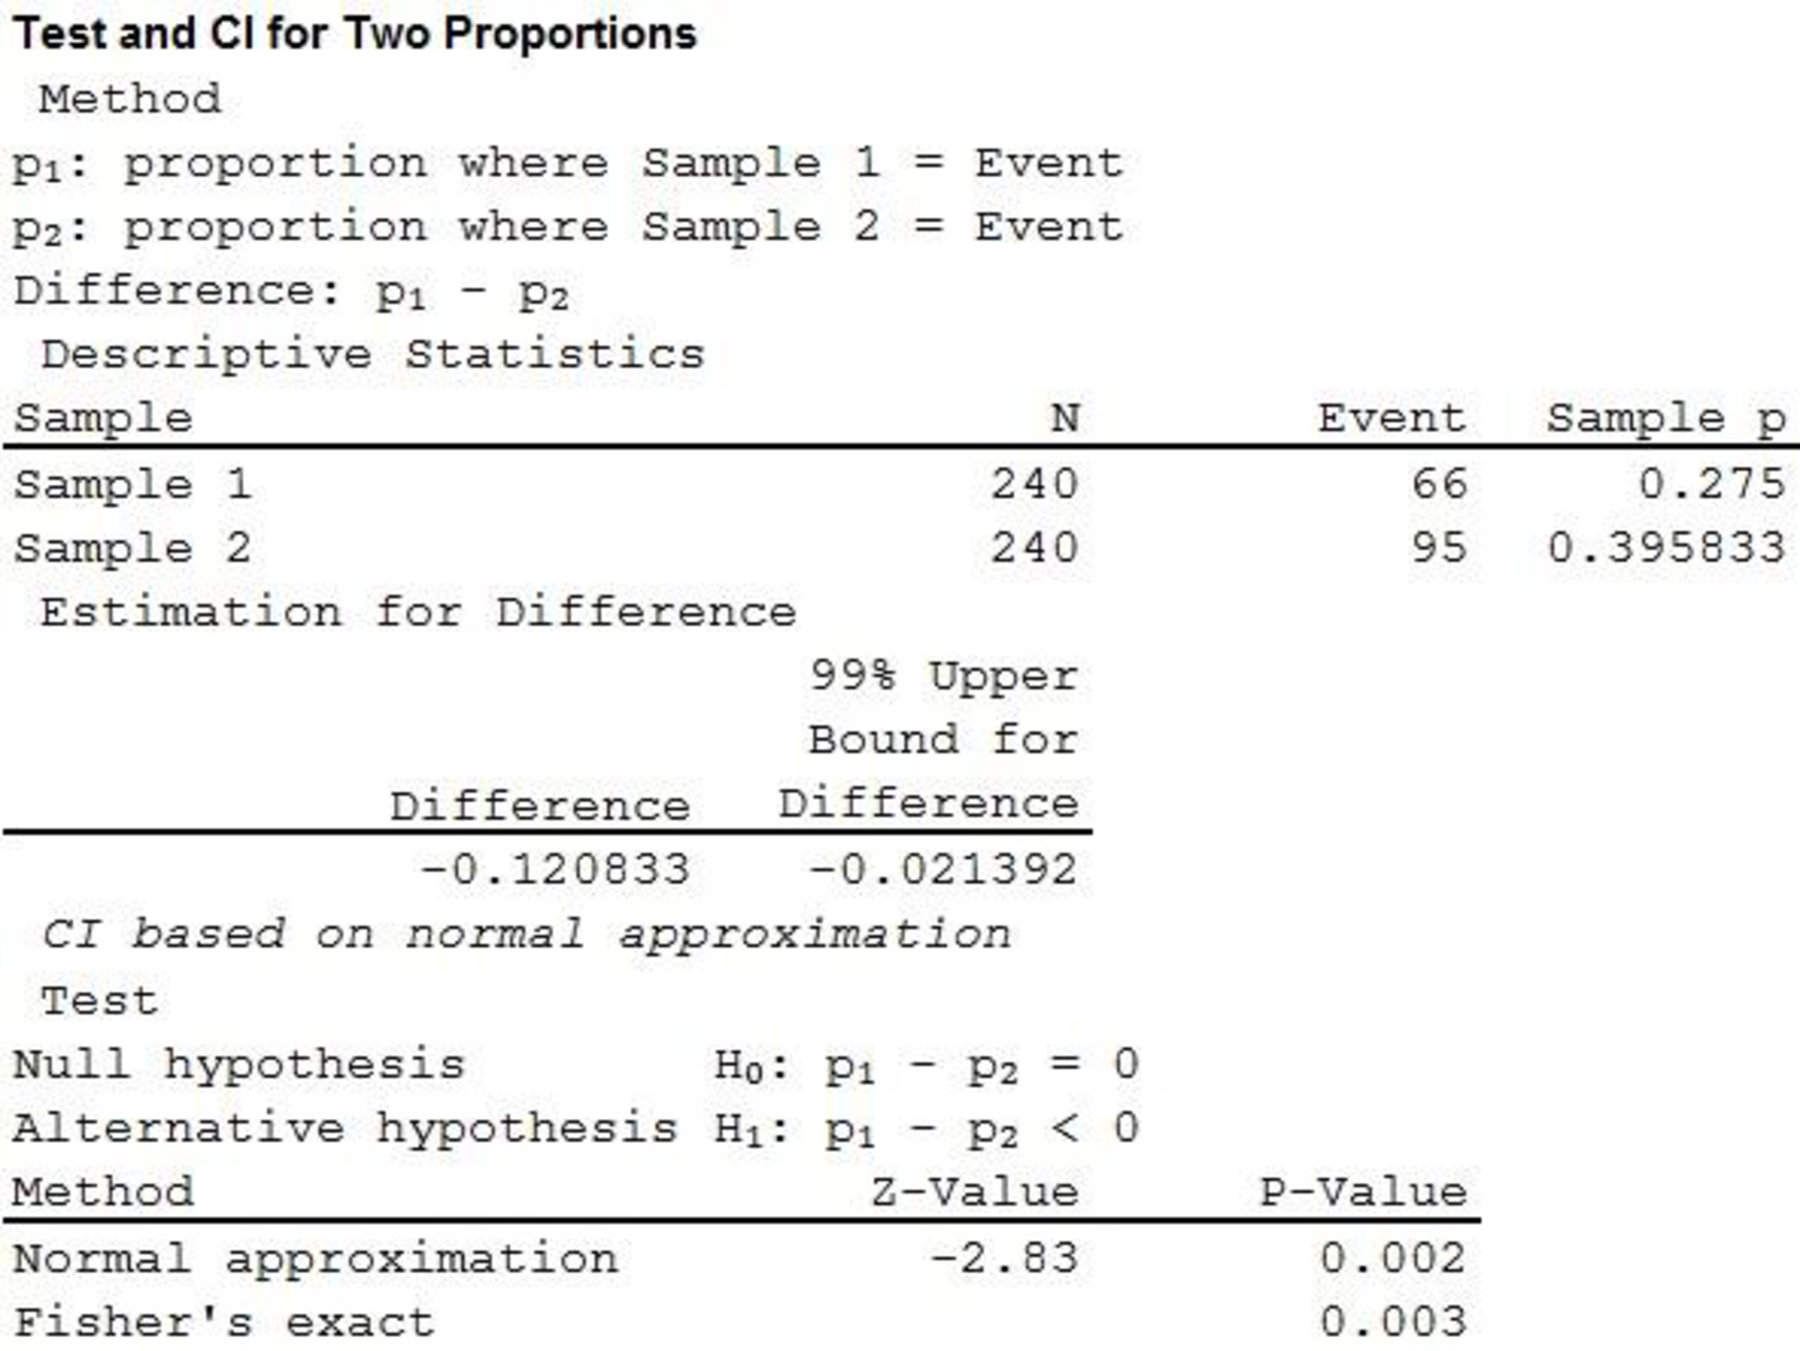
Thus, the p-value is 0.002.

Rejection rule:

If the pvalueα, then reject the null hypothesis.

If the pvalue>α, then do not eject the null hypothesis.

Conclusion:

Here the p-value 0.002 is less than the significance level 0.01.

That is, p-value(0.002)<α(0.01)

Thus, the null hypothesis is rejected.

Therefore, there is sufficient evidence to conclude that, the proportion of the bullish sentiment of individual investors for the most recent week is less than the proportion of the bullish sentiment of individual investors for one month ago.

Interpretation:

Here the null hypothesis H0 is rejected. That is, there is decrease in bullish sentiment over the past month.

Want to see more full solutions like this?

Subscribe now to access step-by-step solutions to millions of textbook problems written by subject matter experts!
Students have asked these similar questions
A research group studying cell phone habits asked the question “Do you ever use your cell phone to make a payment at a convenience store?” to people selected from two random samples of cell phone users. One sample consisted of older adults, ages 35 years and older, and the other sample consisted of younger adults, ages 18 years to 34 years. The proportion of people who answered yes in each sample was used to create a 95 percent confidence interval of (0.097,0.125)(0.097,0.125) to estimate the difference (younger minus older) between the population proportions of people who would answer yes to the question. Which of the following is the best description of what is meant by 95 percent confidence?     In repeated random sampling with the same sample size, approximately 95% of the sample proportions from the younger group will be between 0.097 and 0.125 greater than the sample proportion from the older group. A In repeated random sampling with the same sample size,…

Chapter 10 Solutions

Statistics for Business & Economics, Revised (MindTap Course List)

Ch. 10.2 - Consider the following data for two independent...Ch. 10.2 - The U.S. Department of Transportation provides the...Ch. 10.2 - The average annual cost (including tuition, room,...Ch. 10.2 - Are nursing salaries in Tampa, Florida, lower than...Ch. 10.2 - Commercial real estate prices and rental rates...Ch. 10.2 - The College Board provided comparisons of...Ch. 10.2 - Periodically, Merrill Lynch customers are asked to...Ch. 10.2 - Researchers at Purdue University and Wichita State...Ch. 10.3 - Consider the following hypothesis test. H0:d0Ha:d0...Ch. 10.3 - The following data are from matched samples taken...Ch. 10.3 - A market research firm used a sample of...Ch. 10.3 - The price per share of stock for a sample of 25...Ch. 10.3 - Bank of Americas Consumer Spending Survey...Ch. 10.3 - The Global Business Travel Association reported...Ch. 10.3 - The College Board SAT college entrance exam...Ch. 10.3 - Scores in the first and fourth (final) rounds for...Ch. 10.3 - A manufacturer produces both a deluxe and a...Ch. 10.4 - Consider the following results for independent...Ch. 10.4 - Consider the hypothesis test H0:p1p20Ha:p1p20 The...Ch. 10.4 - A Businessweek/Harris survey asked senior...Ch. 10.4 - The Professional Golf Association (PGA) measured...Ch. 10.4 - An American Automobile Association (AAA) study...Ch. 10.4 - Chicago OHare and Atlanta Hartsfield-Jackson are...Ch. 10.4 - Businessweek reported that there seems to be a...Ch. 10.4 - In a test of the quality of two television...Ch. 10.4 - Winter visitors are extremely important to the...Ch. 10.4 - The Adecco Workplace Insights Survey sampled men...Ch. 10 - Safegate Foods, Inc., is redesigning the checkout...Ch. 10 - Home values tend to increase over time under...Ch. 10 - Mutual funds are classified as load or no-load...Ch. 10 - The National Association of Home Builders provided...Ch. 10 - Prob. 42SECh. 10 - Country Financial, a financial services company,...Ch. 10 - A large automobile insurance company selected...Ch. 10 - Medical tests were conducted to learn about...Ch. 10 - Vacation occupancy rates were expected to be up...Ch. 10 - Prob. 47SECh. 10 - One of the researchers voiced concern about the...
Knowledge Booster
Background pattern image
Statistics
Learn more about
Need a deep-dive on the concept behind this application? Look no further. Learn more about this topic, statistics and related others by exploring similar questions and additional content below.
Recommended textbooks for you
Text book image
Glencoe Algebra 1, Student Edition, 9780079039897...
Algebra
ISBN:9780079039897
Author:Carter
Publisher:McGraw Hill
Text book image
College Algebra (MindTap Course List)
Algebra
ISBN:9781305652231
Author:R. David Gustafson, Jeff Hughes
Publisher:Cengage Learning
Hypothesis Testing using Confidence Interval Approach; Author: BUM2413 Applied Statistics UMP;https://www.youtube.com/watch?v=Hq1l3e9pLyY;License: Standard YouTube License, CC-BY
Hypothesis Testing - Difference of Two Means - Student's -Distribution & Normal Distribution; Author: The Organic Chemistry Tutor;https://www.youtube.com/watch?v=UcZwyzwWU7o;License: Standard Youtube License