bartleby

Videos

Question
Book Icon
Chapter 10, Problem 7CRP

(a)

To determine

(i)

Identify the problem based on the scenario.

Find the level of significance.

State the null and alternative hypothesis.

(ii)

Find the sample test statistic.

(iii)

Find the P-value of the sample test statistic.

(iv)

Check whether the null hypothesis is rejected or fail to reject.

(v)

Interpret the conclusion in the context of the application.

(a)

Expert Solution
Check Mark

Answer to Problem 7CRP

(i)

The problem is classified as chi-square test of variance.

The level of significance is 0.01.

Null hypothesis: H0:σ2=1,040,400.

Alternative hypothesis: H1:σ2>1,040,400.

(ii)

The sample test statistic is 51.03.

(iii)

The P-value of the sample test statistic is 0.007.

(iv)

The null hypothesis is rejected.

Explanation of Solution

Calculation:

(i)

A study is conducted by consumer agency for determining the blowout pressures of Soap Stone tires. The claim of the test is that the variance of blowout pressures is more than Soap Stone. The chi-square test of variance is appropriate because the variance of the population has to be tested.

Hence, the problem is classified as chi-square test of variance.

Let σ2 denotes the variance of blowout pressures.

From the given information the value of α is 0.01, and to test the claim that the variance of blowout pressures is more than Soap Stone claims. The standard deviation of 1,020 foot-pounds than the variance is 1,040,400(=1,0202).

Hence, the level of significance is 0.01.

The null and alternative hypothesis is,

Null hypothesis:

H0:σ2=1,040,400

That is, the variance of blowout pressures is 1,040,400.

Alternative hypothesis:

H1:σ2>1,040,400

That is, the variance of blowout pressures is more than 1,040,400.

(ii)

Test statistic:

The sample chi-square test statistic is,

χ2=(n1)s2σ2

In the formula σ2 is given in the null hypothesis H0, s2 is the sample variance, n denotes the sample size, with degrees of freedom d.f.=n1.

From the given information, a random sample of 30 Soap Stone tires were inflated to the recommended pressure with a sample standard deviation of blowout forces was 1353 foot-pounds.

Step by step procedure to obtain test statistic using MINITAB software is given below:

  • Choose Stat > Basic Statistics > 1 Variance.
  • Under Data, choose Sample standard deviation.
  • Enter Sample size as 30.
  • Enter Sample standard deviation as 1,353.
  • Check Perform hypothesis test.
  • Choose Hypothesized standard deviation.
  • Enter the Value as 1,020.
  • Select Options and enter the Confidence level as 99.0 and Alternative as greater than. Click OK.
  • Click OK.

Output using MINITAB software is given below:

Bundle: Understandable Statistics: Concepts And Methods, 12th + Jmp Printed Access Card For Peck's Statistics + Webassign Printed Access Card For ... And Methods, 12th Edition, Single-term, Chapter 10, Problem 7CRP

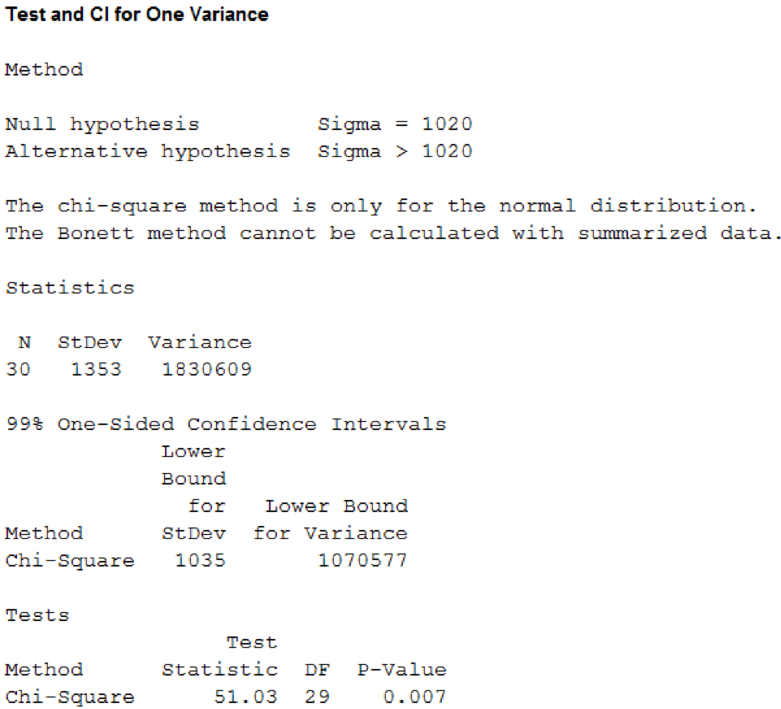
From the MINITAB output, the sample test statistic value is 51.03.

Hence, the sample test statistic is 51.03.

(iii)

From part (ii) Minitab output, the P-value is 0.007.

Hence, the P-value of the sample test statistic is 0.007.

(iv)

Rejection rule:

  • If the P-value is less than or equal to α, then reject the null hypothesis and the test is statistically significant. That is, P-valueα.

Conclusion:

The P-value is 0.007 and the level of significance is 0.01.

The P-value is less than the level of significance.

That is, 0.007(=P-value)<0.01(=α).

By the rejection rule, the null hypothesis is rejected.

Hence, the null hypothesis of independence is rejected.

(v)

There is sufficient evidence that the variance of blowout pressures is more than Soap Stone claims at level of significance 0.01.

(b)

To determine

Find the 95% confidence interval for the variance of blowout pressures.

(b)

Expert Solution
Check Mark

Answer to Problem 7CRP

The 95% confidence interval for the variance of blowout pressures is 1,161,147.4<σ2<3,307,642.4 square foot-pounds.

Explanation of Solution

Calculation:

Confidence interval:

The confidence interval for the population variance σ2 is,

(n1)s2χU2<σ2<(n1)s2χL2

In the formula c is confidence level, s2 is the sample variance, n denotes the sample size, χU2 is chi-square value using d.f.=n1 and right-tail area (1c)2, and χL2 is chi-square value using d.f.=n1 and right-tail area (1+c)2.

Critical value for χU2:

The right-tail area is,

(1c)2=(10.95)2=0.052=0.025

From part (a) MINITAB output, the degrees of freedom are 29.

Use the Appendix II: Tables, Table 7: The χ2 distribution:

  • In d.f. column locate the value 29.
  • In Right-tail Area row of locate the value 0.025.
  • The intersecting value of row and columns is 45.72.

The value of χU2 is 45.72.

Critical value for χL2:

The right-tail area is,

(1+c)2=(1+0.95)2=1.952=0.975

Use the Appendix II: Tables, Table 7: The χ2 distribution:

  • In d.f. column locate the value 29.
  • In Right-tail Area row of locate the value 0.975.
  • The intersecting value of row and columns is 16.05.

The value of χL2 is 16.05.

Substitute 30 for n, 1,353 for s, 45.72 for χU2, and 16.05 for χL2 in the confidence interval formula.

(301)(1,353)245.72<σ2<(301)(1,353)216.0553,087,66145.72<σ2<53,087,66116.051,161,147.4<σ2<3,307,642.4

Hence, the 95% confidence interval for the variance of blowout pressures is 1,161,147.4<σ2<3,307,642.4 square foot-pounds.

Want to see more full solutions like this?

Subscribe now to access step-by-step solutions to millions of textbook problems written by subject matter experts!

Chapter 10 Solutions

Bundle: Understandable Statistics: Concepts And Methods, 12th + Jmp Printed Access Card For Peck's Statistics + Webassign Printed Access Card For ... And Methods, 12th Edition, Single-term

Ch. 10.1 - Prob. 11PCh. 10.1 - For Problems 919, please provide the following...Ch. 10.1 - Prob. 13PCh. 10.1 - Prob. 14PCh. 10.1 - Prob. 15PCh. 10.1 - Prob. 16PCh. 10.1 - Prob. 17PCh. 10.1 - For Problems 919, please provide the following...Ch. 10.1 - Prob. 19PCh. 10.2 - Statistical Literacy For a chi-square...Ch. 10.2 - Prob. 2PCh. 10.2 - Statistical Literacy Explain why goodness-of-fit...Ch. 10.2 - Prob. 4PCh. 10.2 - For Problems 516, please provide the following...Ch. 10.2 - For Problems 516, please provide the following...Ch. 10.2 - Prob. 7PCh. 10.2 - For Problems 516, please provide the following...Ch. 10.2 - For Problems 516, please provide the following...Ch. 10.2 - For Problems 516, please provide the following...Ch. 10.2 - For Problems 516, please provide the following...Ch. 10.2 - For Problems 516, please provide the following...Ch. 10.2 - For Problems 516, please provide the following...Ch. 10.2 - Prob. 14PCh. 10.2 - Prob. 15PCh. 10.2 - Prob. 16PCh. 10.2 - Prob. 17PCh. 10.2 - Prob. 18PCh. 10.3 - Statistical Literacy Does the x distribution need...Ch. 10.3 - Critical Thinking The x distribution must be...Ch. 10.3 - Prob. 3PCh. 10.3 - For Problems 311, please provide the following...Ch. 10.3 - For Problems 311, please provide the following...Ch. 10.3 - For Problems 311, please provide the following...Ch. 10.3 - For Problems 311, please provide the following...Ch. 10.3 - For Problems 311, please provide the following...Ch. 10.3 - For Problems 311, please provide the following...Ch. 10.3 - For Problems 311, please provide the following...Ch. 10.3 - Prob. 11PCh. 10.4 - Prob. 1PCh. 10.4 - Statistical Literacy When using the F distribution...Ch. 10.4 - Prob. 3PCh. 10.4 - Prob. 4PCh. 10.4 - Prob. 5PCh. 10.4 - Prob. 6PCh. 10.4 - Prob. 7PCh. 10.4 - Prob. 8PCh. 10.4 - Prob. 9PCh. 10.4 - For Problems 512, please provide the following...Ch. 10.4 - Prob. 11PCh. 10.4 - Prob. 12PCh. 10.5 - In each problem, assume that the distributions are...Ch. 10.5 - Prob. 2PCh. 10.5 - Prob. 3PCh. 10.5 - Prob. 4PCh. 10.5 - Prob. 5PCh. 10.5 - Prob. 6PCh. 10.5 - Prob. 7PCh. 10.5 - Prob. 8PCh. 10.5 - Prob. 9PCh. 10.6 - Prob. 1PCh. 10.6 - Prob. 2PCh. 10.6 - Prob. 3PCh. 10.6 - Prob. 4PCh. 10.6 - Prob. 5PCh. 10.6 - Prob. 6PCh. 10.6 - Prob. 7PCh. 10 - Prob. 1CRPCh. 10 - Prob. 2CRPCh. 10 - Prob. 3CRPCh. 10 - Prob. 4CRPCh. 10 - Prob. 5CRPCh. 10 - Before you solve Problems 514, first classify the...Ch. 10 - Prob. 7CRPCh. 10 - Prob. 8CRPCh. 10 - Prob. 9CRPCh. 10 - Prob. 10CRPCh. 10 - Prob. 11CRPCh. 10 - Prob. 12CRPCh. 10 - Prob. 13CRPCh. 10 - Prob. 14CRPCh. 10 - Prob. 1DHCh. 10 - Prob. 1LCCh. 10 - Prob. 2LCCh. 10 - Prob. 1UTCh. 10 - Prob. 2UTCh. 10 - Prob. 3UT
Knowledge Booster
Background pattern image
Statistics
Learn more about
Need a deep-dive on the concept behind this application? Look no further. Learn more about this topic, statistics and related others by exploring similar questions and additional content below.
Recommended textbooks for you
Text book image
Glencoe Algebra 1, Student Edition, 9780079039897...
Algebra
ISBN:9780079039897
Author:Carter
Publisher:McGraw Hill
Introduction to experimental design and analysis of variance (ANOVA); Author: Dr. Bharatendra Rai;https://www.youtube.com/watch?v=vSFo1MwLoxU;License: Standard YouTube License, CC-BY