
Elementary Statistics: Picturing the World (6th Edition)
6th Edition
ISBN: 9780321911216
Author: Ron Larson, Betsy Farber
Publisher: PEARSON
expand_more
expand_more
format_list_bulleted
Videos
Textbook Question
Chapter 10.3, Problem 22E
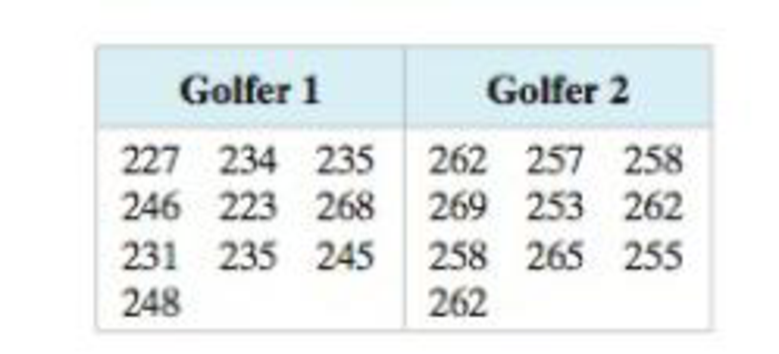
Performing a Two-Sample F-Test In Exercises 19−26, (a) identify the claim and state H0, and Ha (b) find the critical value and identify the rejection region, (c) find the test statistic F, (d) decide whether to reject or fail to reject the null hypothesis, and (e) interpret the decision in the context of the original claim. Assume the samples are random and independent, and the populations are
22. Golf The table at the left shows a sample of the driving distances (in yards) for two golfers. At a = 0.10, can you conclude that the variances of the driving distances differ between the two golfers?
Expert Solution & Answer
Want to see the full answer?
Check out a sample textbook solution
Students have asked these similar questions
Testing Hypotheses. In Exercises 13–24, assume that a simple random sample has been selected and test the given claim. Unless specified by your instructor, use either the P-value method or the critical value method for testing hypotheses. Identify the null and alternative hypotheses, test statistic, P-value (or range of P-values), or critical value(s), and state the final conclusion that addresses the original claim.
Lead in Medicine Listed below are the lead concentrations (in μ g/g) measured in different Ayurveda medicines. Ayurveda is a traditional medical system commonly used in India. The lead concentrations listed here are from medicines manufactured in the United States (based on data from “Lead, Mercury, and Arsenic in US and Indian Manufactured Ayurvedic Medicines Sold via the Internet,” by Saper et al., Journal of the American Medical Association, Vol. 300, No. 8). Use a 0.05 significance level to test the claim that the mean lead concentration for all such medicines is…
Testing Claims About Variation. In Exercises 5–16, test the given claim. Identify the null hypothesis, alternative hypothesis, test statistic, P-value, or critical value(s), then state the conclusion about the null hypothesis, as well as the final conclusion that addresses the original claim. Assume that a simple random sample is selected from a normally distributed population.
Bank Lines The Jefferson Valley Bank once had a separate customer waiting line at each teller window, but it now has a single waiting line that feeds the teller windows as vacancies occur. The standard deviation of customer waiting times with the old multiple-line configuration was 1.8 min. Listed below is a simple random sample of waiting times (minutes) with the single waiting line. Use a 0.05 significance level to test the claim that with a single waiting line, the waiting times have a standard deviation less than 1.8 min. What improvement occurred when banks changed from multiple waiting lines to a single…
Testing Claims About Variation. In Exercises 5–16, test the given claim. Identify the null hypothesis, alternative hypothesis, test statistic, P-value, or critical value(s), then state the conclusion about the null hypothesis, as well as the final conclusion that addresses the original claim. Assume that a simple random sample is selected from a normally distributed population.
Fast Food Drive-Through Service Times Listed below are drive-through service times (seconds) recorded at McDonald’s during dinner times (from Data Set 25 “Fast Food” in Appendix B). Assuming that dinner service times at Wendy’s have standard deviation σ = 55.93 sec, use a 0.01 significance level to test the claim that service times at McDonald’s have the same variation as service times at Wendy’s. Should McDonald’s take any action?
Chapter 10 Solutions
Elementary Statistics: Picturing the World (6th Edition)
Ch. 10.1 - Prob. 1TYCh. 10.1 - Prob. 2TYCh. 10.1 - Prob. 3TYCh. 10.1 - What is a multinomial experiment?Ch. 10.1 - What conditions are necessary to use the...Ch. 10.1 - Finding Expected Frequencies In Exercises 36, find...Ch. 10.1 - Finding Expected Frequencies In Exercises 36, find...Ch. 10.1 - Finding Expected Frequencies In Exercises 36, find...Ch. 10.1 - Finding Expected Frequencies In Exercises 36, find...Ch. 10.1 - Prob. 7E
Ch. 10.1 - Prob. 8ECh. 10.1 - Performing a Chi-Square Goodness-of-Fit Test In...Ch. 10.1 - Prob. 10ECh. 10.1 - Prob. 11ECh. 10.1 - Prob. 12ECh. 10.1 - Performing a Chi-Square Goodness-of-Fit Test In...Ch. 10.1 - Performing a Chi-Square Goodness-of-Fit Test In...Ch. 10.1 - Performing a Chi-Square Goodness-of-Fit Test In...Ch. 10.1 - Prob. 16ECh. 10.1 - In Exercises 17 and 18, (a) find the expected...Ch. 10.1 - In Exercises 17 and 18, (a) find the expected...Ch. 10.2 - Prob. 1TYCh. 10.2 - Prob. 2TYCh. 10.2 - Prob. 3TYCh. 10.2 - Prob. 1ECh. 10.2 - Explain the difference between marginal...Ch. 10.2 - Prob. 3ECh. 10.2 - Prob. 4ECh. 10.2 - Prob. 5ECh. 10.2 - True or False? In Exercises 5 and 6, determine...Ch. 10.2 - Finding Expected Frequencies In Exercises 712, (a)...Ch. 10.2 - Finding Expected Frequencies In Exercises 712, (a)...Ch. 10.2 - Prob. 9ECh. 10.2 - Prob. 10ECh. 10.2 - Prob. 11ECh. 10.2 - Prob. 12ECh. 10.2 - Performing a Chi-Square Independence Test In...Ch. 10.2 - Performing a Chi-Square Independence Test In...Ch. 10.2 - Performing a Chi-Square Independence Test In...Ch. 10.2 - Prob. 16ECh. 10.2 - Prob. 17ECh. 10.2 - Performing a Chi-Square Independence Test In...Ch. 10.2 - Prob. 19ECh. 10.2 - Prob. 20ECh. 10.2 - Prob. 21ECh. 10.2 - Prob. 22ECh. 10.2 - Prob. 23ECh. 10.2 - Prob. 24ECh. 10.2 - Prob. 25ECh. 10.2 - Prob. 26ECh. 10.2 - Prob. 27ECh. 10.2 - Prob. 28ECh. 10.2 - Prob. 29ECh. 10.2 - Prob. 30ECh. 10.2 - Prob. 31ECh. 10.2 - Prob. 32ECh. 10.2 - Prob. 33ECh. 10.2 - Prob. 34ECh. 10.2 - Prob. 35ECh. 10.2 - In your opinion, how safe is the food you buy? CBS...Ch. 10.2 - In your opinion, how safe is the food you buy? CBS...Ch. 10.2 - In your opinion, how safe is the food you buy? CBS...Ch. 10.2 - In your opinion, how safe is the food you buy? CBS...Ch. 10.2 - In your opinion, how safe is the food you buy? CBS...Ch. 10.2 - In your opinion, how safe is the food you buy? CBS...Ch. 10.3 - Prob. 1TYCh. 10.3 - Prob. 2TYCh. 10.3 - Prob. 3TYCh. 10.3 - Prob. 4TYCh. 10.3 - Explain how to find the critical value for an...Ch. 10.3 - List five properties of the F-distribution.Ch. 10.3 - List the three conditions that must be met in...Ch. 10.3 - Explain how to determine the values of d.f.N and...Ch. 10.3 - Prob. 5ECh. 10.3 - Prob. 6ECh. 10.3 - Prob. 7ECh. 10.3 - Finding a Critical F-Value for a Right-Tailed Test...Ch. 10.3 - Prob. 9ECh. 10.3 - Finding a Critical F-Value for a Right-Tailed Test...Ch. 10.3 - Finding a Critical F-Value for a Right-Tailed Test...Ch. 10.3 - Finding a Critical F-Value for a Right-Tailed Test...Ch. 10.3 - In Exercises 1318, test the claim about the...Ch. 10.3 - In Exercises 1318, test the claim about the...Ch. 10.3 - Prob. 15ECh. 10.3 - Prob. 16ECh. 10.3 - Prob. 17ECh. 10.3 - In Exercises 1318, test the claim about the...Ch. 10.3 - Performing a Two-Sample F-Test In Exercises 1926,...Ch. 10.3 - Prob. 20ECh. 10.3 - Prob. 21ECh. 10.3 - Performing a Two-Sample F-Test In Exercises 1926,...Ch. 10.3 - Performing a Two-Sample F-Test In Exercises 1926,...Ch. 10.3 - Prob. 24ECh. 10.3 - Prob. 25ECh. 10.3 - Performing a Two-Sample F-Test In Exercises 1926,...Ch. 10.3 - Prob. 27ECh. 10.3 - In Exercises 27 and 28, find the right- and...Ch. 10.3 - In Exercises 29 and 30, construct the confidence...Ch. 10.3 - In Exercises 29 and 30, construct the confidence...Ch. 10.4 - Prob. 1TYCh. 10.4 - Prob. 2TYCh. 10.4 - Slate the null and alternative hypotheses for a...Ch. 10.4 - What conditions are necessary in order to use a...Ch. 10.4 - Describe the difference between the variance...Ch. 10.4 - Prob. 4ECh. 10.4 - Performing a One-Way ANOVA Test In Exercises 514,...Ch. 10.4 - Prob. 6ECh. 10.4 - Prob. 7ECh. 10.4 - Prob. 8ECh. 10.4 - Prob. 9ECh. 10.4 - Prob. 10ECh. 10.4 - Prob. 11ECh. 10.4 - Prob. 12ECh. 10.4 - Prob. 13ECh. 10.4 - Prob. 14ECh. 10.4 - Prob. 15ECh. 10.4 - Prob. 16ECh. 10.4 - Prob. 17ECh. 10.4 - Prob. 18ECh. 10.4 - The Scheff Test If the null hypothesis is rejected...Ch. 10.4 - Prob. 20ECh. 10.4 - Prob. 21ECh. 10.4 - Prob. 22ECh. 10 - In Exercises 14. (a) identify the claim and state...Ch. 10 - Prob. 10.1.2RECh. 10 - In Exercises 14, (a) identify the claim and state...Ch. 10 - Prob. 10.1.4RECh. 10 - Prob. 10.2.5RECh. 10 - Prob. 10.2.6RECh. 10 - Prob. 10.2.7RECh. 10 - Prob. 10.2.8RECh. 10 - Prob. 10.3.9RECh. 10 - Prob. 10.3.10RECh. 10 - Prob. 10.3.11RECh. 10 - Prob. 10.3.12RECh. 10 - Prob. 10.3.13RECh. 10 - Prob. 10.3.14RECh. 10 - Prob. 10.3.15RECh. 10 - Prob. 10.3.16RECh. 10 - Prob. 10.3.17RECh. 10 - Prob. 10.3.18RECh. 10 - Prob. 10.3.19RECh. 10 - Prob. 10.3.20RECh. 10 - Prob. 10.4.21RECh. 10 - Prob. 10.4.22RECh. 10 - Prob. 1CQCh. 10 - Prob. 2CQCh. 10 - Prob. 3CQCh. 10 - Prob. 4CQCh. 10 - Prob. 1CTCh. 10 - Prob. 2CTCh. 10 - Prob. 3CTCh. 10 - Prob. 4CTCh. 10 - Prob. 5CTCh. 10 - Prob. 6CTCh. 10 - Prob. 1RSRDCh. 10 - Independence The contingency table below shows the...Ch. 10 - Prob. 1TCh. 10 - Prob. 2TCh. 10 - Prob. 3TCh. 10 - Prob. 4TCh. 10 - Prob. 5TCh. 10 - Prob. 1CRCh. 10 - Prob. 2CRCh. 10 - Prob. 3CRCh. 10 - Prob. 4CRCh. 10 - Prob. 5CRCh. 10 - Reviewing a Movie The contingency table shows how...Ch. 10 - Prob. 7CR
Knowledge Booster


Learn more about
Need a deep-dive on the concept behind this application? Look no further. Learn more about this topic, statistics and related others by exploring similar questions and additional content below.Similar questions
- Testing Hypotheses. In Exercises 13–24, assume that a simple random sample has been selected and test the given claim. Unless specified by your instructor, use either the P-value method or the critical value method for testing hypotheses. Identify the null and alternative hypotheses, test statistic, P-value (or range of P-values), or critical value(s), and state the final conclusion that addresses the original claim. Car Booster Seats The National Highway Traffic Safety Administration conducted crash tests of child booster seats for cars. Listed below are results from those tests, with the measurements given in hic (standard head injury condition units). The safety requirement is that the hic measurement should be less than 1000 hic. Use a 0.01 significance level to test the claim that the sample is from a population with a mean less than 1000 hic. Do the results suggest that all of the child booster seats meet the specified requirement?arrow_forwardTesting Claims About Variation. In Exercises 5–16, test the given claim. Identify the null hypothesis, alternative hypothesis, test statistic, P-value, or critical value(s), then state the conclusion about the null hypothesis, as well as the final conclusion that addresses the original claim. Assume that a simple random sample is selected from a normally distributed population. Aircraft Altimeters The Skytek Avionics company uses a new production method to manufacture aircraft altimeters. A simple random sample of new altimeters resulted in the errors listed below. Use a 0.05 level of significance to test the claim that the new production method has errors with a standard deviation greater than 32.2 ft, which was the standard deviation for the old production method. If it appears that the standard deviation is greater, does the new production method appear to be better or worse than the old method? Should the company take any action?arrow_forwardTesting Hypotheses. In Exercises 13–24, assume that a simple random sample has been selected and test the given claim. Unless specified by your instructor, use either the P-value method or the critical value method for testing hypotheses. Identify the null and alternative hypotheses, test statistic, P-value (or range of P-values), or critical value(s), and state the final conclusion that addresses the original claim. Heights of Supermodels Listed below are the heights (cm) for the simple random sample of female supermodels Lima, Bundchen, Ambrosio, Ebanks, Iman, Rubik, Kurkova, Kerr, Kroes, Swanepoel, Prinsloo, Hosk, Kloss, Robinson, Heatherton, and Refaeli. Use a 0.01 significance level to test the claim that supermodels have heights with a mean that is greater than the mean height of 162 cm for women in the general population. Given that there are only 16 heights represented, can we really conclude that supermodels are taller than the typical woman?arrow_forward
- Testing Claims About Variation. In Exercises 5–16, test the given claim. Identify the null hypothesis, alternative hypothesis, test statistic, P-value, or critical value(s), then state the conclusion about the null hypothesis, as well as the final conclusion that addresses the original claim. Assume that a simple random sample is selected from a normally distributed population. Coffee Vending Machines The Brazil vending machine dispenses coffee, and a random sample of 27 filled cups have contents with a mean of 7.14 oz and a standard deviation of 0.17 oz. Use a 0.05 significance level to test the claim that the machine dispenses amounts with a standard deviation greater than the standard deviation of 0.15 oz specified in the machine design.arrow_forwardTesting Claims About Variation. In Exercises 5–16, test the given claim. Identify the null hypothesis, alternative hypothesis, test statistic, P-value, or critical value(s), then state the conclusion about the null hypothesis, as well as the final conclusion that addresses the original claim. Assume that a simple random sample is selected from a normally distributed population. Pulse Rates of Women Repeat the preceding exercise using the pulse rates of women listed in Data Set 1 “Body Data” in Appendix B. For the sample of pulse rates of women, n = 147 and s = 12.5. See the accompanying JMP display that results from using the original list of pulse rates instead of the summary statistics. (Hint: The bottom three rows of the display provide P -values for a two-tailed test, a left-tailed test, and a right-tailed test, respectively.) What do the results indicate about the effectiveness of using the range rule of thumb with the “normal range” from 60 to 100 beats per minute for estimating…arrow_forwardTesting Claims About Proportions. In Exercises 7–22, test the given claim. Identify the null hypothesis, alternative hypothesis, test statistic, P-value or critical value(s), then state the conclusion about the null hypothesis, as well as the final conclusion that addresses the original claim. Does Aspirin Prevent Heart Disease? In a trial designed to test the effectiveness of aspirin in preventing heart disease, 11,037 male physicians were treated with aspirin and 11,034 male physicians were given placebos. Among the subjects in the aspirin treatment group, 139 experienced myocardial infarctions (heart attacks). Among the subjects given placebos, 239 experienced myocardial infarctions (based on data from “Final Report on the Aspirin Component of the Ongoing Physicians’ Health Study,” New England Journal of Medicine , Vol. 321: 129–135). Use a 0.05 significance level to test the claim that aspirin has no effect on myocardial infarctions. a. Test the claim using a hypothesis test. b.…arrow_forward
- Testing Claims About Variation. In Exercises 5–16, test the given claim. Identify the null hypothesis, alternative hypothesis, test statistic, P-value, or critical value(s), then state the conclusion about the null hypothesis, as well as the final conclusion that addresses the original claim. Assume that a simple random sample is selected from a normally distributed population. Mint Specs Listed below are weights (grams) from a simple random sample of “wheat” pennies (from Data Set 29 “Coin Weights” in Appendix B). U.S. Mint specifications now require a standard deviation of 0.0230 g for weights of pennies. Use a 0.01 significance level to test the claim that wheat pennies are manufactured so that their weights have a standard deviation equal to 0.0230 g. Does the Mint specification appear to be met?arrow_forwardTesting Claims About Variation. In Exercises 5–16, test the given claim. Identify the null hypothesis, alternative hypothesis, test statistic, P-value, or critical value(s), then state the conclusion about the null hypothesis, as well as the final conclusion that addresses the original claim. Assume that a simple random sample is selected from a normally distributed population. Body Temperature Example 5 in Section 8-3 involved a test of the claim that humans have body temperatures with a mean equal to 98.6°F. The sample of 106 body temperatures has a standard deviation of 0.62°F. The conclusion in that example would change if the sample standard deviation s were 2.08°F or greater. Use a 0.01 significance level to test the claim that the sample of 106 body temperatures is from a population with a standard deviation less than 2.08°F. What does the result tell us about the validity of the hypothesis test in Example 5 in Section 8-3?arrow_forwardTesting Claims About Proportions. In Exercises 7–22, test the given claim. Identify the null hypothesis, alternative hypothesis, test statistic, P-value or critical value(s), then state the conclusion about the null hypothesis, as well as the final conclusion that addresses the original claim. Cell Phones and Handedness A study was conducted to investigate the association between cell phone use and hemispheric brain dominance. Among 216 subjects who prefer to use their left ear for cell phones, 166 were right-handed. Among 452 subjects who prefer to use their right ear for cell phones, 436 were right-handed (based on data from “Hemispheric Dominance and Cell Phone Use,” by Seidman et al., JAMA Otolaryngology—Head & Neck Surgery, Vol. 139, No. 5). We want to use a 0.01 significance level to test the claim that the rate of right-handedness for those who prefer to use their left ear for cell phones is less than the rate of right-handedness for those who prefer to use their right ear…arrow_forward
- Testing Hypotheses. In Exercises 13–24, assume that a simple random sample has been selected and test the given claim. Unless specified by your instructor, use either the P-value method or the critical value method for testing hypotheses. Identify the null and alternative hypotheses, test statistic, P-value (or range of P-values), or critical value(s), and state the final conclusion that addresses the original claim. Insomnia Treatment A clinical trial was conducted to test the effectiveness of the drug zopiclone for treating insomnia in older subjects. Before treatment with zopiclone, 16 subjects had a mean wake time of 102.8 min. After treatment with zopiclone, the 16 subjects had a mean wake time of 98.9 min and a standard deviation of 42.3 min (based on data from “Cognitive Behavioral Therapy vs Zopiclone for Treatment of Chronic Primary Insomnia in Older Adults,” by Sivertsen et al., Journal of the American Medical Association, Vol. 295, No. 24). Assume that the 16 sample values…arrow_forwardTesting Claims About Variation. In Exercises 5–16, test the given claim. Identify the null hypothesis, alternative hypothesis, test statistic, P-value, or critical value(s), then state the conclusion about the null hypothesis, as well as the final conclusion that addresses the original claim. Assume that a simple random sample is selected from a normally distributed population. Spoken Words Couples were recruited for a study of how many words people speak in a day. A random sample of 56 males resulted in a mean of 16,576 words and a standard deviation of 7871 words. Use a 0.01 significance level to test the claim that males have a standard deviation that is greater than the standard deviation of 7460 words for females (based on Data Set 24 “Word Counts”).arrow_forwardTesting Normality For the hypothesis test described in Exercise 2, the sample sizes are n1 = 147 and n2 = 153. When using the F test with these data, is it correct to reason that there is no need to check for normality because n1 > 30 and n2 > 30?arrow_forward
arrow_back_ios
SEE MORE QUESTIONS
arrow_forward_ios
Recommended textbooks for you

 Functions and Change: A Modeling Approach to Coll...AlgebraISBN:9781337111348Author:Bruce Crauder, Benny Evans, Alan NoellPublisher:Cengage Learning
Functions and Change: A Modeling Approach to Coll...
Algebra
ISBN:9781337111348
Author:Bruce Crauder, Benny Evans, Alan Noell
Publisher:Cengage Learning
Hypothesis Testing using Confidence Interval Approach; Author: BUM2413 Applied Statistics UMP;https://www.youtube.com/watch?v=Hq1l3e9pLyY;License: Standard YouTube License, CC-BY
Hypothesis Testing - Difference of Two Means - Student's -Distribution & Normal Distribution; Author: The Organic Chemistry Tutor;https://www.youtube.com/watch?v=UcZwyzwWU7o;License: Standard Youtube License