
Videos
Refer to the study description and sample statistics given in the previous exercise.
- a. Suppose that the
sample size was 500. Carry out a hypothesis test to decide if there is evidence that the average time spent playing video or computer games for male Canadian high school students is greater than 2 hours. Use a significance level of 0.05. - b. Now suppose that the sample standard deviation had been 37.1 rather titan 117.1. Carry out a hypothesis test to decide if there is evidence that the average time spent playing video or computer games for male Canadian high school students is greater than 2 hours. Use a significance level of 0.05.
- c. Explain why the null hypothesis was rejected in the test of Part (d) but not in the test of Part (c).
10.58. In a study of media use, each person in a large representative sample of male Canadian high school students was asked how much time they spent playing video or computer games (in minutes per day). The sample mean was 123.4 minutes and the sample standard deviation was 117.1 minutes.
- a. Based on the given sample mean and standard deviation, is it reasonable to think that the distribution of time spent playing video or computer games for the population of male Canadian high school students is approximately normal? Explain why or why not.
- b. Suppose you wanted to use the sample data to decide if there is evidence that the average time spent playing video or computer games for male Canadian high school students is greater than 2 hours (120 minutes). What would you need to know to determine if the one-sample t test is an appropriate method?
a.
Check whether the sample provides convincing evidence that the average time spent in playing video or computer games for male Canadian high school students is greater than 2 hours (120 minutes) at the significance level of 0.05.
Answer to Problem 59E
No, the sample does not provide the evidence that the average time spent in playing video or computer games for the male Canadian high school students is greater than 2 hours.
Explanation of Solution
Calculation:
The given information states about the study of media use. It is given that the sample of size 100 has the mean time spent in playing video games as 123.4 mean with its corresponding standard deviation as 117.1 minutes.
Step 1:
Population characteristic of interest:
Let
In this context, denote
Step 2:
Null hypothesis:
That is, the average time spent in playing video or a computer games for the male Canadian high school students is 120 minutes.
Step 3:
Alternative hypothesis:
That is, the average time spent in playing video or a computer games for the male Canadian high school students is greater than 120 minutes.
Step 4:
Significance level
It is given that the significance level
Step 5:
Test statistic:
The t-test statistic is as follows:
Where,
Substitute the hypothesized proportion
Here, the sample mean
Step 6:
Assumptions for performing a hypothesis test about
- The sample mean
- The population distribution should be distributed approximately normally or the sample size should be greater than 30. That is,
Requirement check:
- It is assumed that the sample of 500 acts as the representative of all the male Canadian high school students, and therefore, the samples can be treated as a random sample from that particular population.
- In this context, the sample size is large enough. That is,
Thus, the conditions are satisfied.
Step 7:
The value of the test statistic is obtained as follows:
Software procedure:
Step-by-step procedure to find the test statistic using the MINITAB software:
- Choose Stat > Basic Statistics > 1-Sample t.
- Choose Summarized data, enter the Sample size as 500, Sample mean as 123.4 and Standard deviation as 117.1.
- Enter Hypothesized mean as 120.
- Select Options.
- Choose
- Click OK in all dialogue boxes.
Output using the MINITAB software is given below:
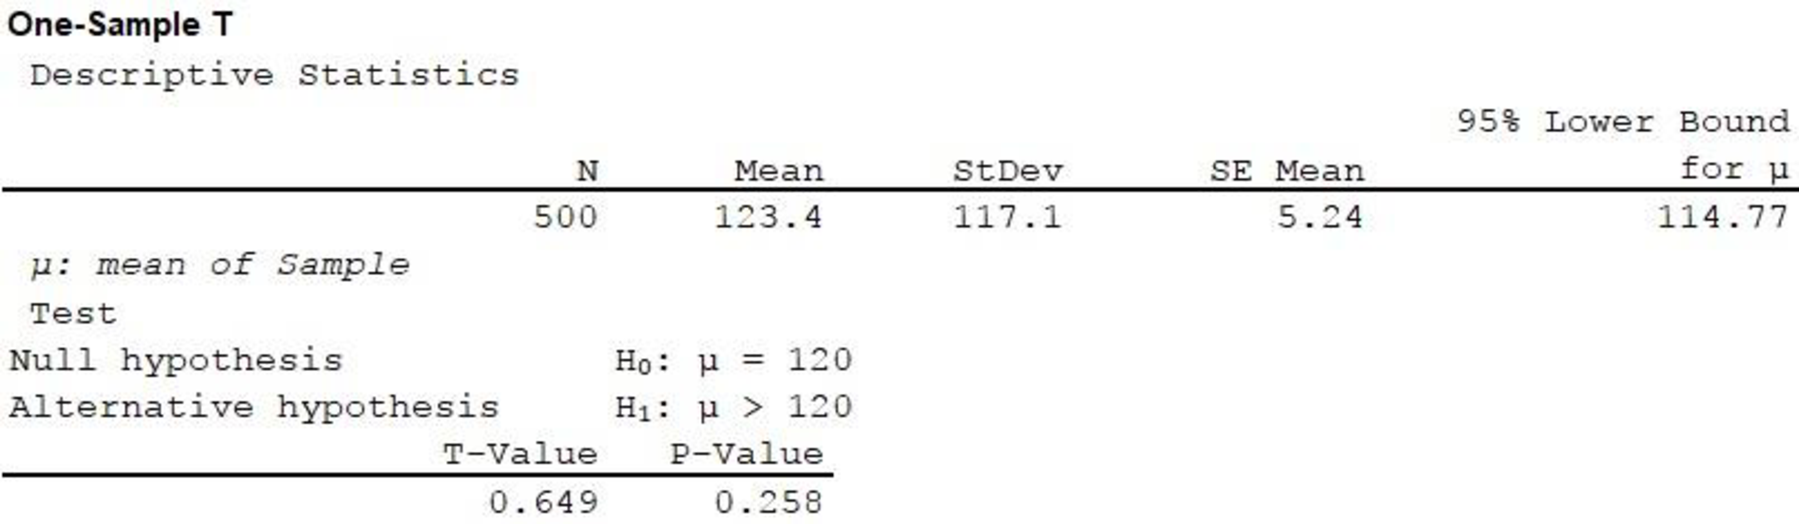
From the MINITAB output, the test statistic, that is, the t-value is 0.649.
Thus, the value of test statistic is 0.649.
Step 8:
P-value:
In this context, the alternative hypothesis denotes that the test carried out is a right-tailed test. Therefore, the P-value is the area under the z curve to the right of the calculated z value.
From the output, the P-value is 0.258.
Step 9:
Decision rule:
- If
- If
Conclusion:
Here, the
That is,
The decision is that the null hypothesis is not rejected.
Thus, the sample does not provide the evidence that the average time spent in playing video or computer games for the male Canadian high school students is greater than 2 hours (120 minutes) at the significance level of 0.05.
b.
Check whether the sample provides convincing evidence that the average time spent in playing video or computer games for the male Canadian high school students is greater than 2 hours (120 minutes) at the significance level of 0.05.
Answer to Problem 59E
Yes, the sample provides the evidence that the average time spent in playing video or computer games for the male Canadian high school students is greater than 2 hours.
Explanation of Solution
Calculation:
The given information states about the study of media use. It is given that the sample size of 100 has the mean time spent in playing video games as 123.4 mean with its corresponding standard deviation as 37.1 minutes.
Step 1:
Population characteristic of interest:
Let
In this context, denote
Step 2:
Null hypothesis:
That is, the average time spent in playing video or a computer games for the male Canadian high school students is 120 minutes.
Step 3:
Alternative hypothesis:
That is, the average time spent in playing video or a computer games for the male Canadian high school students is greater than 120 minutes.
Step 4:
Significance level
It is given that the significance level
Step 5:
Test statistic:
The t-test statistic is as follows::
Where,
Substitute the hypothesized proportion,
Here, the sample mean
Step 6:
Assumptions for performing a hypothesis test about
- The sample mean
- The population distribution should be distributed to normal approximately or the sample size should be greater than 30. That is,
Requirement check:
- It is assumed that the sample of 500 acts as the representative of all the male Canadian high school students, and therefore, the samples can be treated as a random sample from that particular population.
- In this context, the sample size is large enough. That is,
Thus, the conditions are satisfied.
Step 7:
The value of the test statistic is obtained as follows:
Software procedure:
Step-by-step procedure to find the test statistic using the MINITAB software:
- Choose Stat > Basic Statistics > 1-Sample t.
- Choose Summarized data, enter the Sample size as 500, Sample mean as 123.4 and Standard deviation as 37.1.
- Enter Hypothesized mean as 120.
- Select Options.
- Choose
- Click OK in all dialogue boxes.
Output using the MINITAB software is given below:
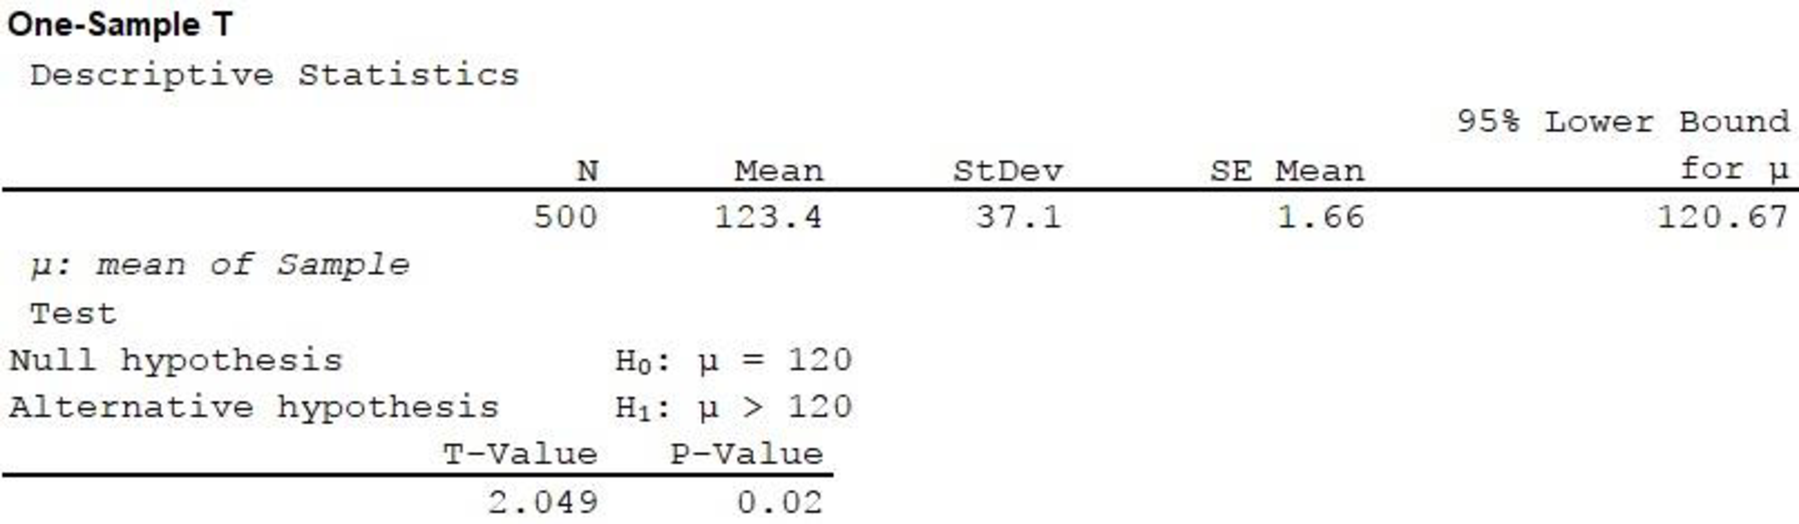
From the MINITAB output, the test statistic, that is, the t-value is 2.049.
Thus, the value of test statistic is 2.049.
Step 8:
P-value:
In this context, the alternative hypothesis denotes that the test carried out is a right-tailed test. Therefore, the P-value is the area under the z curve to the right of the calculated z value.
From the output, the P-value is 0.02.
Step 9:
Decision rule:
- If
- If
Conclusion:
Here, the
That is,
The decision is that the null hypothesis is rejected.
Thus, it can be concluded that the average time spent in playing video or computer games for the male Canadian high school students is greater than 2 hours (120 minutes) at the significance level of 0.05.
c.
Delineate the reason for rejecting the null hypothesis in Part (b) and not rejecting the null hypothesis in Part (a).
Explanation of Solution
The sample standard deviation used in Part (b) means that there is less variation in the time spent in playing video or computer game, whereas the sample standard deviation used in Part (a) means more variation. When the population mean of the average time spent in playing video or computer game for the male Canadian high school students is 120 minutes, it is less likely for the sample mean to be 123.4 minutes when the standard deviation is 37.1 minutes than when the standard deviation is 117.1 minutes. Therefore, greater the standard deviation, the more is the variability in the sample. Thus, higher the standard deviation in Part (a) the greater is the difficulty to reject the null hypothesis, which results in not rejecting the null hypothesis in Part (a).
Want to see more full solutions like this?
Chapter 10 Solutions
Introduction To Statistics And Data Analysis


 Glencoe Algebra 1, Student Edition, 9780079039897...AlgebraISBN:9780079039897Author:CarterPublisher:McGraw Hill