
Videos
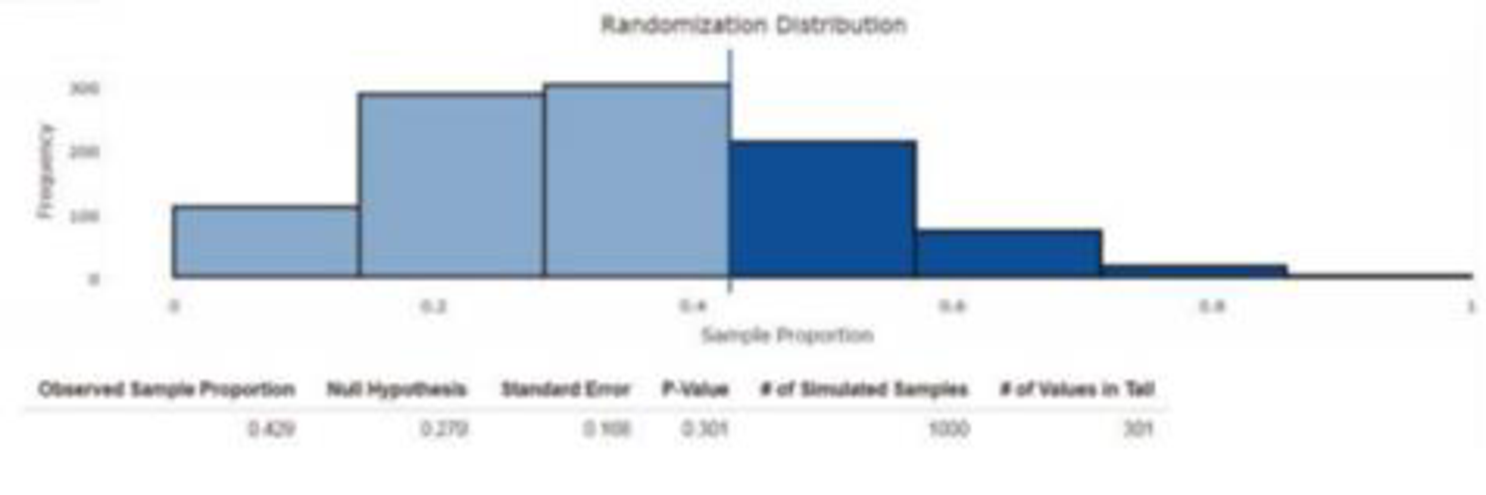
We are only beginning to learn about the long-term effects of space travel on human health. A study published in 2016 (Nature Scientific Reports 6, Article number: 29901, nature.com/articles/srep29901, July 28, 2016, retrieved May 6, 2017) found that by 2014, seven of the U.S. astronauts who traveled to the moon during Apollo lunar missions of the 1960s and 1970s had died, and that three of these (3/7 = 43%) had died from cardiovascular disease (CVD). The overall U.S. death rate due to CVD for adults age 55 to 64 in 2013 was 27%. Do the data for lunar astronauts indicate that, as a group, they are at increased risk of death caused by CVD? Assume that it is reasonable to regard this sample as representative of the population of past, present, and future U.S. lunar astronauts.
- a. Explain why the data in this example should not be analyzed using a large-sample hypothesis test for a population proportion.
- b. Use the output at the top of the next page from the Shiny app “Randomization Test for One Proportion” to complete an appropriate hypothesis test.
Output for Exercise 10.74
Want to see the full answer?
Check out a sample textbook solution
Chapter 10 Solutions
Introduction To Statistics And Data Analysis


- One of the purposes of an investigation by Porcellini et al. was to investigate the effect on CD4 T cell count of administration of intermittent interleukin (IL-2) in addition to highly active antiretroviral therapy (HAART). The following table shows the CD4 T cell count at baseline and then again after 12 months of HAART therapy with IL-2. Do the data show, at the 0.05 level, a significant change in CD4 T cell count?arrow_forwardA large research project showed that in a sample of 750 adults, 60 of them experienced a midlife crisis . Use this data to test the claim that the percentage of adults who experienced midlife crisis is less than 10%. Use (alpha)= 0.05 .arrow_forwardA study was conducted to examine if children with autism spectrum disorder (ASD) had higher prenatal exposure to air pollution, specifically particulate matter < 2.5 g in diameter (PM2.5). Researchers obtained birth records of all children born in Los Angeles between 2000 and 2008 and linked these to the Department of Developmental Services records to determine if any of those subjects had been diagnosed with ASD or not. They used the birth addresses given in the birth records to determine the average daily PM2.5 for the third trimester for each child. The standard deviation for PM2.5 among ASD subjects was found to be 34.6 and for non-ASD subjects was 16.8. Assume PM2.5 is normally distributed. 4a. What was the study design? * Randomized Clinical Trial (RCT) * Case Report * Nested Case-Control Study * Case-Control Study * cross-sectional study Cohort Study 4B. What are the null and alternative hypotheses? 4c. What type of statistical test would you use to analyze the…arrow_forward
- A cohort study is conducted to assess the association between clinical characteristics and the risk of stroke. The study involves n=1,250 participants who are free of stroke at the study start. Each participant is assessed at study start (baseline) and every year thereafter for five years. The following table displays data on hypertensive status measured at baseline and incident stroke over 5 years. Free of Stroke at 5 Years Stroke Baseline: Not Hypertensive 952 46 Baseline: Hypertensive 234 18 Compute the population attributable risk of stroke for patients with hypertension.arrow_forwardStock y has a beta of 1.2 and an expected return of 11.5. Stock z has a beta of .80 and an expected return of 8.5 percentarrow_forwardA survey in 2019 asked a random sample of U.S. adults if they believed the government was tracking all or most of their activities online or on their cell phones. Of the 671 adults aged 18–29, 396 said “yes.” Of the 977 adults aged 65 or older, 293 said “yes.” Do we have evidence to claim that the proportion is higher among the young adults as compared to the older adults? (test hypothesis at level alpha =0.05).arrow_forward
- HIV/AIDS patients are regularly monitored for their CD4 counts in order to make sure that antiretroviral therapies are effectiveSuppose the distribution of CD4 counts in a population is approximately normal with mu = 237 and sigma = 43 . HIV patients are defined as moving into the AIDS stage of their disease course after their CD4 counts are less than 200. What proportion of patients in this population is suffering from AIDS?arrow_forwardwhy is the DV female drosophila Do you use a z or test for this problem?arrow_forwardResearchers interested in lead exposure due to car exhaust sampled the blood of 52 police officers subjected to constant inhalation of automobile exhaust fumes while working traffic enforcement in a primarily urban environment. The blood samples of these officers had an average lead concentration of 124.32 µg/l and an SD of 37.74 µg/l; a previous study of individuals from a nearby suburb, with no history of exposure, found an average blood level concentration of 35 µg/l. Write down the hypotheses that would be appropriate for testing if the police officers appear to have been exposed to a higher concentration of lead. Explicitly state and check all conditions necessary for inference on these data. Test the hypothesis that the downtown police officers have a higher lead exposure than the group in the previous study. Interpret your results in context. Based on your preceding result, without performing a calculation, would a 99% confidence interval for the average blood concentration…arrow_forward
- According to the National Health and Nutrition Examination Survey (NHANES) sponsored by the U.S. government, a random sample of 712 males between 20 and 29 years of age and a random sample of 1,001 males over the age of 75 were chosen and the weight of each of the males were recorded (in kg). Do the data provide evidence that the younger male population weighs more (on average) than the older male population? Use “Y” for ages 20-29 and “S” for ages 75+. It was found that x̅Y=83.4, sY=18.7, x̅S=78.5, and sS=19.0. a)Suppose the test statistic is t = 2.398. What is the associated p-value? Group of answer choices 0.001 < p-value < 0.002 0.005 < p-value < 0.01 0.01 < p-value < 0.02 0.0005 < p-value < 0.001 b) Suppose the p-value is 0.02 < p-value < 0.04. At α = 0.10 what is the appropriate conclusion to make? Group of answer choices Fail to reject H0 and conclude that the mean weight of all males ages 20-29 is greater than the mean weight of all…arrow_forwardAccording to the National Health and Nutrition Examination Survey (NHANES) sponsored by the U.S. government, a random sample of 712 males between 20 and 29 years of age and a random sample of 1,001 males over the age of 75 were chosen and the weight of each of the males were recorded (in kg). Do the data provide evidence that the younger male population weighs more (on average) than the older male population? Use “Y” for ages 20-29 and “S” for ages 75+. It was found that x̅Y=83.4, sY=18.7, x̅S=78.5, and sS=19.0. A) What are the correct null and alternative hypotheses? B)What is the parameter of interest? The difference between the mean weight of all males ages 20-29 and the mean weight of all males ages 75+ The mean weight (in kg) The difference between the mean weight of the sample of males ages 20-29 and the mean weight of the sample of males ages 75+ The mean difference between the weights of males ages 20-29 and males ages 75+ c)Is the randomness condition met for…arrow_forwardIn Table 11.2 the estimated coefficient on black is 0.084 in column (1),0.688 in column (2), and 0.389 in column (3). In spite of these large differences, all three models yield similar estimates of the marginal effect of race on the probability of mortgage denial. How can this be?arrow_forward
 Linear Algebra: A Modern IntroductionAlgebraISBN:9781285463247Author:David PoolePublisher:Cengage Learning