
Exploring Macroeconomics
8th Edition
ISBN: 9781544363332
Author: Robert L. Sexton
Publisher: Sage Publications
expand_more
expand_more
format_list_bulleted
Videos
Textbook Question
Chapter 11, Problem 10P
Nominal
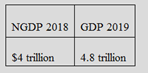
Can you say that the production of goods and services in Nowhereland has increased between 2018 and 2019? Why or why not?
Expert Solution & Answer
Want to see the full answer?
Check out a sample textbook solution
Students have asked these similar questions
Nominal GDP in Nowhereland in 2002 and 2003 increased from $4 trillion to $4.8 trillion. Can you say that the production of goods and services in Nowhereland has increased between 2002 and 2003? Why or why not?
The participation of women in the U.S. labor force has risen dramatically since 1970.
How do you this this rise affected GDP?
Now imagine a measure of well-being that includes time spent working in the home and taking leisure. How would the change in this measure of well-being compare to the change in GDP?
Can you think of other aspects of well-being that are associated with the rise in women’s labor-force participation? Would it be practical to construct a measure of well-being that includes these aspects?
According to the Bureau of Economic Analysis, the GDP Deflator for the 3rd Quarter 2021 is +5.7%. The U.S. Bureau of Labor Statistics reported the Consumer Price Index (CPI) as rising 5.4 percent over the last 12 months, not seasonally adjusted. Given this information:
1) Interpret these data and summarize its meaning.
2) What are these data measuring?
3) If you were a business economist, which would you use and why?
Knowledge Booster


Learn more about
Need a deep-dive on the concept behind this application? Look no further. Learn more about this topic, economics and related others by exploring similar questions and additional content below.Similar questions
- List some of the reasons why economists should not consider GDP an effective measure of the standard of living in a county.arrow_forwardGDP deflator (GDP deflator for year t = nominal GDP for year t divided by the real GDP for year t) is a price index representing the overall price level in the economy. The CPI (the consumer price index) is also a price index representing the overall price level in the economy. Which of the below is best explains why they are different? The GDP deflator does not reflect the prices of exported goods and services, whereas the consumer price index does not reflect the prices of the imported goods and services. The GDP deflator reflects the prices of goods and services bought by producers, whereas the consumer price index reflects the prices of goods and services bought by consumers. The GDP deflator reflects the prices of intermediate goods and services bought by producers, whereas the consumer price index reflects the prices of goods and services bought by consumers.arrow_forwardCalculate the Nominal GDP and the Real GDP for 2020, using 2019 as the base year. The average consumer in Locolandia purchases 10 boxes of Raw Chocolate Chips, 25 chocolate bars and 3 kg of Sugar per year.arrow_forward
- What is a real GDP? Why do economists prefer to use that as a measurement over regular GDP?arrow_forwardA small nation of ten people idolizes the TV show American Idol. All they produce and consume are karaoke machine and CDs, in the following amounts: i) Using a method similar to the consumer price index, compute the percentage change in the overall price level. Use 2011 as the base year and fix the basket at 1 karaoke machine and 3 CDs. ii) Using a method similar to the GDP deflator, compute the percentage change in the overall price level. Use 2011 as the base year. iii) Is the inflation rate in 2012 the same using the two methods? Explain why or why not?arrow_forwardAssume that in the year 2010, the US Nominal GDP was $15 trillion, while the GDP deflator was 200. Calculate the US Real GDP for 2010. $30 trillion $300 trillion $7.5 trillion $0.75 trillionarrow_forward
arrow_back_ios
arrow_forward_ios
Recommended textbooks for you


 Economics (MindTap Course List)EconomicsISBN:9781337617383Author:Roger A. ArnoldPublisher:Cengage Learning


Economics (MindTap Course List)
Economics
ISBN:9781337617383
Author:Roger A. Arnold
Publisher:Cengage Learning
Forecasting: Exponential Smoothing, MSE; Author: Joshua Emmanuel;https://www.youtube.com/watch?v=k_HN0wOKDd0;License: Standard Youtube License