
Concept explainers
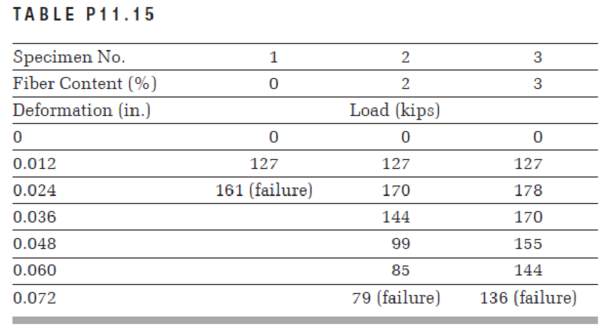
Three 6 in. × 12 in. concrete cylinders with randomly oriented steel fiber contents of 0, 2, and 3% by weight, respectively. After curing for 28 days, the specimens were subjected to increments of compressive loads until failure. The load versus deformation results were as shown in Table P11.15.
Assuming that the gauge length is the whole specimen height, determine the following:
a. The compressive stresses and strains for each specimen at each load increment.
b. Plot stresses versus strains for all specimens on one graph.
c. The modulus of elasticity for each specimen.
d. The ultimate strength for each specimen.
e. The strain at failure for each specimen.
f. Toughness. Curves may be approximated with a series of straight lines.
g. Comment on the effects of increasing the fiber content on the following:
i. Modulus of elasticity
ii. Ultimate strength
iii. Ductility
iv. Toughness

Learn your wayIncludes step-by-step video

Chapter 11 Solutions
Pearson eText for Materials for Civil and Construction Engineers -- Instant Access (Pearson+)
Additional Engineering Textbook Solutions
Foundation Design: Principles and Practices (3rd Edition)
Electrical Engineering: Principles & Applications (7th Edition)
C Programming Language
Database Concepts (7th Edition)
Problem Solving with C++ (10th Edition)
Starting Out with C++: Early Objects (9th Edition)


- ! Three 150 mm x 300 mm concrete cylinders with randomly oriented steel fiber contents of 0, 2, and 3% by weight, respectively. After curing for 28 days, the specimens were subjected to increments of compressive loads until fail- ure. The load versus deformation results were as shown in Table P11.14. TABLE P11.14 Specimen No. Fiber Content (%) 1 2 3 2 Deformation (mm) Load (kN) 0.31 565 565 565 0.61 716 (failure) 756 792 0.91 641 756 1.22 440 690 1.52 378 641 1.83 351 (failure) 605 (failure) Assuming that the gauge length is the whole specimen height, determine the following: a. The compressive stresses and strains for each specimen at each load increment. b. Plot stresses versus strains for all specimens on one graph. c. The modulus of elasticity for each specimen. d. The ultimate strength for each specimen. e. The strain at failure for each specimen. f. Toughness. Curves may be approximated with a series of straight lines. g. Comment on the effects of increasing the fiber content on…arrow_forwardA 150mm x 300mm long cylindrical concrete specimen was tested for tensile strength. The sample failed when the applied force is 150,000N. What is the splitting tensile strength in MPa?arrow_forwardWhich strain and stress profiles shown in the figure below best represent a reinforced concrete section subjected to flexure at the ultimate limit state?arrow_forward
- A cylindrical concrete specimen was tested for compressive strength. The stress at failure was 22.64 MPa when the applied force was 400,000N. What is the diameter of the specimen in mm? Round off your answer to the nearest whole number.arrow_forwardA cylindrical brass specimen having a diameter of 1.10 cm and initial gage length of 4.04 cm is subjected to tensile strength test. The load-deformation values are given in the below table. The final length and final diameter of the specimen were measured as 4.33 cm and 0.92 cm, respectively. Complete the below table and plot true stress-true strain diagram and determine. Yield strength at 0.2 % off-set method. Poisson’s ratio of the material at 135 kN load (assume that there is no volume change) If the material were unloaded from 175 kN, what would be its final length? 1 nm=1*10-9 m, 1 0A=10-10 marrow_forwardWhen a specimen of M25 concrete is loaded to a stress level of 12.5 MPa, a strain of 500x10^-6 is recorded. If this load is allowed to stand for a long time, the strain increases to 1000 x 10^-6. In accordance with provisions of IS: 456-2000,considering the long-term effects, the effective modulus of elasticity of the concrete (in MPa) isarrow_forward
- A 300mm long cylindrical concrete specimen was tested for tensile strength. When the applied load is 205,000N, the sample failed with a tensile strength of 2.90 MPa. What is the diameter of the specimen in mm? Round off your answer to the nearest whole number.arrow_forwardA concrete test cylinder having length L=12 in and diameter d=6 in is subjected to axial compressive forces P in a testing machine. If the maximum shear stress in the concrete is not to exceed 2,000 psi, what is the safe value for the axial load p?A. 452,389 lb. B. 113,100 lb. C. 904,778 lb. D. 56,550 lb. The answer for this is letter B 113,100 lb but I dont know its solution. Please give me complete solution in order to get the 113,100 lb.arrow_forwardThree 150 mm * 300 mm concrete cylinders with water to cement ratios of 0.4, 0.6, and 0.8, respectively. After curing for 28 days, the specimens were subjected to increments of compressive loads until failure. The load versus deformation results were as shown in Table .Assuming that the gauge length is the whole specimen height, it is required to do the following:a. The compressive stresses and strains for each specimen at each load increment.b. Plot stresses versus strains for all specimens on one graph.c. The ultimate strength for each specimen.d. The modulus of elasticity as the secant modulus at 40% of the ultimate stress for each specimen. e. The strain at failure for each specimen.f. The toughness for each specimen. g. Comment on the effect of increasing the water–cement ratio on the following:i. Ultimate strengthii. Modulus of elasticityiii. Ductilityiv. Toughness. Curves may be approximated with a series of straight lines.arrow_forward
- A 150mm diameter cylindrical concrete specimen was tested for splitting tensile strength.The splitting tensile stress at failure is 4.14 MPa, what is the applied force in kN?arrow_forwardThe stress-strain diagram of a reinforcement steel having a cross-sectional diameter of 12 mm diameter and 100 mm gage length is determined after its tensile strength test as follows. Based on the stress- strain diagram determine the followings properties of the material (Poisson's ratio of the material is 0.32) : 600 a) Modulus of elasticity 550 500 b) Yield strength 450 c) Toughness 400 350 d) Resilience 300 e) Shear modulus 250 200 f) Bulk modulus 150 g) Ductility as described by 100 percent change in length 50 0.01 0.02 0.03 0.04 0.05 0.06 0.07 0.08 0.09 0.1 0.11 0.12 0.13 0.14 0.15 0.16 0.17 0.18 Strain Stress, MPaarrow_forwardThere are 3 factors that may be the cause of the production error in the reinforced concrete element shown in the figure.arrow_forward

 Structural Analysis (10th Edition)Civil EngineeringISBN:9780134610672Author:Russell C. HibbelerPublisher:PEARSON
 Principles of Foundation Engineering (MindTap Cou...Civil EngineeringISBN:9781337705028Author:Braja M. Das, Nagaratnam SivakuganPublisher:Cengage Learning
 Fundamentals of Structural AnalysisCivil EngineeringISBN:9780073398006Author:Kenneth M. Leet Emeritus, Chia-Ming Uang, Joel LanningPublisher:McGraw-Hill Education
 Traffic and Highway EngineeringCivil EngineeringISBN:9781305156241Author:Garber, Nicholas J.Publisher:Cengage Learning