
UPENN: LOOSE LEAF CORP.FIN W/CONNECT
17th Edition
ISBN: 9781260361278
Author: Ross
Publisher: McGraw-Hill Publishing Co.
expand_more
expand_more
format_list_bulleted
Concept explainers
Videos
Textbook Question
Chapter 11, Problem 29QP
Correlation and Beta You have been provided the following data about the securities of three firms, the market portfolio, and the risk-free asset:
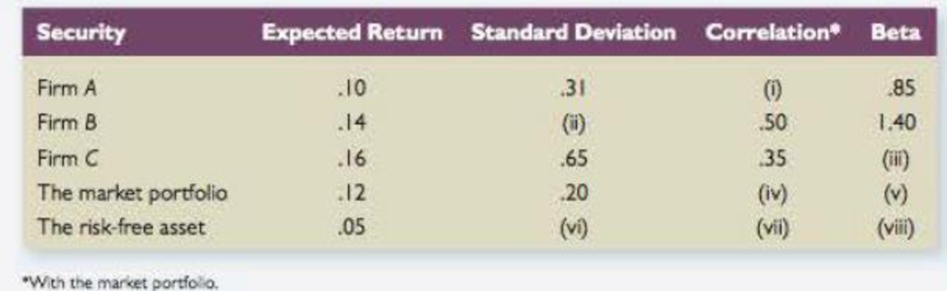
- a. Fill in the missing values in the table.
- b. Is the stock of Firm A correctly priced according to the
capital asset pricing model (CAPM)? What about the stock of Firm B? Finn C? If these securities are not correctly priced, what is your investment recommendation for someone with a well-diversified portfolio?
Expert Solution & Answer
Want to see the full answer?
Check out a sample textbook solution
Students have asked these similar questions
With the aid of relevant examples, contrast value investing with growth investing and show how these are applicable to the portfolio management process.
Discuss which type of shares are most suitable to be assessed with the Piotrowski framework?
3. Critically discuss any recent news article of your choice within the context of the Efficient Market Hypothesis.
4. What are the key differences between the Arbitrage Pricing Theory (APT) and the Capital Asset Pricing Model (CAPM) as they relate to portfolio management?
Consider the stocks in the table with their respective beta coefficients to answer the following questions:a. Which of the assets represents the most sensitive to fluctuations or changes in market returns and why? What impact in terms of risk and return would this asset have if you add it to an investment portfolio in a higher proportion than all other assets?
b. Which of the assets represents the least sensitive to fluctuations or changes in market returns and why? What impact in terms of risk and return would this asset have, if you add it to an investment portfolio in a greater proportion than all other assets?
Stock
Beta
SKT
0.65
COST
0.90
SU
1.42
AMZN
1.57
V
0.94
Consider the following performance data for a portfolio manager:
Benchmark
Portfolio
Index
Portfolio
Weight
Weight
Return
Return
Stocks
0.65
0.7
0.11
0.12
Bonds
0.3
0.25
0.07
0.08
Cash
0.05
0.05
0.03
0.025
a.Calculate the percentage return that can be attributed to the asset allocation decision.
b.Calculate the percentage return that can be attributed to the security selection decision.
Chapter 11 Solutions
UPENN: LOOSE LEAF CORP.FIN W/CONNECT
Ch. 11 - Diversifiable and Nondiversifiable Risks In broad...Ch. 11 - Systematic versus Unsystematic Risk Classify the...Ch. 11 - Expected Portfolio Returns If a portfolio has a...Ch. 11 - Diversification True or false: The most important...Ch. 11 - Portfolio Risk If a portfolio has a positive...Ch. 11 - Beta and CAPM Is it possible that a risky asset...Ch. 11 - Covariance Briefly explain why the covariance of a...Ch. 11 - Prob. 8CQCh. 11 - Prob. 9CQCh. 11 - Prob. 10CQ
Ch. 11 - Determining Portfolio Weights What are the...Ch. 11 - Portfolio Expected Return You own a portfolio that...Ch. 11 - Portfolio Expected Return You own a portfolio that...Ch. 11 - Portfolio Expected Return You have 10,000 to...Ch. 11 - Prob. 5QPCh. 11 - Calculating Returns and Standard Deviations Based...Ch. 11 - Calculating Expected Returns A portfolio is...Ch. 11 - Returns and Standard Deviations Consider the...Ch. 11 - Returns and Standard Deviations Consider the...Ch. 11 - Calculating Portfolio Betas You own a stock...Ch. 11 - Calculating Portfolio Betas You own a portfolio...Ch. 11 - Using CAPM A stock has a beta of 1.15, the...Ch. 11 - Using CAPM A stock has an expected return of 13.4...Ch. 11 - Using CAPM A stock has an expected return of 13.4...Ch. 11 - Using CAPM A stock has an expected return of 11.2...Ch. 11 - Prob. 16QPCh. 11 - Prob. 17QPCh. 11 - Reward-to-Risk Ratios Stock Y has a beta of 1.20...Ch. 11 - Prob. 19QPCh. 11 - Portfolio Returns Using information from the...Ch. 11 - Prob. 21QPCh. 11 - Portfolio Returns and Deviations Consider the...Ch. 11 - Analyzing a Portfolio You want to create a...Ch. 11 - Prob. 24QPCh. 11 - Prob. 25QPCh. 11 - Prob. 26QPCh. 11 - Prob. 27QPCh. 11 - Prob. 28QPCh. 11 - Correlation and Beta You have been provided the...Ch. 11 - CML The market portfolio has an expected return of...Ch. 11 - Beta and CAPM A portfolio that combines the...Ch. 11 - Beta and CAPM Suppose the risk-free rate is 4.7...Ch. 11 - Systematic versus Unsystematic Risk Consider the...Ch. 11 - SML Suppose you observe the following situation:...Ch. 11 - Prob. 35QPCh. 11 - Prob. 36QPCh. 11 - Prob. 37QPCh. 11 - Minimum Variance Portfolio Assume Stocks A and 8...Ch. 11 - Prob. 1MCCh. 11 - Prob. 2MC
Knowledge Booster


Learn more about
Need a deep-dive on the concept behind this application? Look no further. Learn more about this topic, finance and related others by exploring similar questions and additional content below.Similar questions
- What does the capital asset pricing model (CAPM) calculate? a. The expected rate of return on an individual stock with respect to the risk-free rate of return b. The expected rate of return of an individual stock based on its overall risk c. The expected rate of return of an individual stock with respect to its market risk only d. The expected rate of return of an individual stock reflecting its financial risk Clear my choicearrow_forwardQUESTION ONE Why do most investors hold diversified portfolios? and What is covariance, and why is it important in portfolio theory? Why do most assets of the same type show positive covariances of returns with each other? Would you expect positive covariances of returns between differenttypes of assets such as returns on Treasury bills, General Electric common stock, and commercial real estate? Why or why not? What is the relationship between covariance and the correlation coefficient? and Explain the shape of the efficient frontier. Draw a properly labeled graph of the Markowitz efficient frontier. Describe the efficient frontier in exact terms. Discuss the concept of dominant portfolios, and show an example of one on your graph. Assume you want to run a computer program to derive the efficient frontier for your feasible set of stocks. What information must you input to the program?arrow_forwardQuestion 2 a) Plot the Security Market Line (SML).b) Superimpose the CAPM’s required return on the SML.c) Indicate which investments will plot on, above and below the SML?d) If an investment’s expected return (mean return) does not plot on the SML, what doesit show? Identify undervalued/overvalued investments from the grapharrow_forward
- In a CAPM world, what do you need to know in order to estimate an asset's expected return? Group of answer choices The risk free rate, the market risk premium, and the asset's standard deviation The risk free rate, the market risk premium, and the asset's beta The corporate bond rate, the expected return on the S&P 500 and the asset's Beta Market sentiment, historical stock returns and the risk free ratearrow_forwardYou have been provided the following data about the securities of three firms, the market portfolio, and the risk-free asset: a. Fill in the missing values in the table. (Leave no cells blank - be certain to enter 0 wherever required. Do not round intermediate calculations and round your answers to 2 decimal places, e.g., 32.16.) Security Firm A Firm B Firm C The market portfolio The risk-free asset Expected return Expected Return * With the market portfolio Sell Buy 0.118 0.132 0.113 0.12 0.05 % Expected return Standard Deviation b-1. What is the expected return of Firm A? (Do not round intermediate calculations and enter your answer as a percent rounded to 2 decimal places, e.g., 32.16.) 0.23 0.74 0.74 0.23 0 % Correlation* 1.02 0.42 0.27 1 0 b-2. What is your investment recommendation regarding Firm A for someone with a well-diversified portfolio? b-3. What is the expected return of Firm B? (Do not round intermediate calculations and enter your answer as a percent rounded to 2…arrow_forwardSelect all that are takeaways with respect to risk and return in financial markets that we gleaned from historical data. Group of answer choices In a competitive market, one should expect higher returns for taking on more risk In a competitive market, one will earn a higher return if they take on more risk Individual stocks and portfolios (of those individual stocks), by definition, exhibit the same risk-return trade offs We use historical data to quantify the risk-return relation because we know this same relation will hold in the futurearrow_forward
- b. As an equity portfolio manager, you may use certain risk-adjusted performance measures. Describe and discuss the following measures of performance evaluation! Treynor Index, William Sharpe, Michael Jensen Using the following table evaluate which is better than other using three different measure of performance evaluation. Asset X E(R)% 12 beta Stdv 1.25 16 Y 11 1.0 12 Risk-free 3 0 0 Market index 12 1 12arrow_forwardHelp mearrow_forwardWhen working with the CAPM, which of the following factors can be determined with the most precision? a. The beta coefficient of "the market," which is the same as the beta of an average stock. b. The beta coefficient, bi, of a relatively safe stock. c. The market risk premium (RPM). d. The most appropriate risk-free rate, rRF. e. The expected rate of return on the market, rM.arrow_forward
- According to the capital asset pricing model (CAPM), fairly priced securities should have __________. Select one: a. A fair return based on the level of systematic risk. b. A beta of 1. c. A return equal to the market return. d. A fair return based on the level of unsystematic risk.arrow_forwardQUESTION Given a simple world with two assets, a bond fund and a stock fund, clearly detail the steps involved in arriving at the 1) efficient frontier, and 2) market (optimal) portfolio. What is the significance of the Capital Market Line? To be more specific, what relationship does this line depict? Give a brief discussion on its application. One important assumption behind portfolio theory is that investors are “mean-variance maximizers.” What is the meaning of this? Explain why this assumption is important in the delineation of the efficient frontier.arrow_forwardPlease do a and b separate (Question 2) a) Plot the Security Market Line (SML)b) Superimpose the CAPM’s required return on the SMLc) Indicate which investments will plot on, above and below the SML? d) If an investment’s expected return (mean return) does not plot on the SML, what doesit show? Identify undervalued/overvalued investments from the graph.arrow_forward
arrow_back_ios
SEE MORE QUESTIONS
arrow_forward_ios
Recommended textbooks for you
 EBK CONTEMPORARY FINANCIAL MANAGEMENTFinanceISBN:9781337514835Author:MOYERPublisher:CENGAGE LEARNING - CONSIGNMENT
 Intermediate Financial Management (MindTap Course...FinanceISBN:9781337395083Author:Eugene F. Brigham, Phillip R. DavesPublisher:Cengage Learning
 Pfin (with Mindtap, 1 Term Printed Access Card) (...FinanceISBN:9780357033609Author:Randall Billingsley, Lawrence J. Gitman, Michael D. JoehnkPublisher:Cengage Learning
EBK CONTEMPORARY FINANCIAL MANAGEMENT
Finance
ISBN:9781337514835
Author:MOYER
Publisher:CENGAGE LEARNING - CONSIGNMENT
Intermediate Financial Management (MindTap Course...
Finance
ISBN:9781337395083
Author:Eugene F. Brigham, Phillip R. Daves
Publisher:Cengage Learning
Pfin (with Mindtap, 1 Term Printed Access Card) (...
Finance
ISBN:9780357033609
Author:Randall Billingsley, Lawrence J. Gitman, Michael D. Joehnk
Publisher:Cengage Learning
Portfolio return, variance, standard deviation; Author: MyFinanceTeacher;https://www.youtube.com/watch?v=RWT0kx36vZE;License: Standard YouTube License, CC-BY