
Basic Business Statistics Student Value Edition Plus NEW MyLab Statistics with Pearson eText -- Access Card Package (13th Edition)
13th Edition
ISBN: 9780133873641
Author: Mark L. Berenson, David M. Levine, Kathryn A. Szabat
Publisher: PEARSON
expand_more
expand_more
format_list_bulleted
Concept explainers
Videos
Textbook Question
Chapter 11, Problem 39PS
A metallurgy company wanted to investigate the effect of the percentage of ammonium and the stir rate on the density of the powder produced. The result (stored in Density) are as follow:
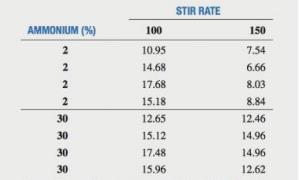
At the 0.05 level of significance,
a. is there an interaction between the percentage of ammonium and the stir rate?
b. is there an effect due to the percentage of ammonium?
c. is there an effect due to the stir rate?
d. Plot the mean density for each percentage of ammonium for each stir rate.
e. Discuss the results of (a) through (d).
Expert Solution & Answer
Want to see the full answer?
Check out a sample textbook solution
Students have asked these similar questions
For making a scatter plot of the data set, which would be the best scale and interval for the axis that represents the amount of fluoride?
An experiment was conducted to study the extrusion process of biodegradable packaging foam. Two of the factors considered for their effect on the foam diameter (mm) were the die temperature(145°C vs.155°C) and the die diameter (3 mm vs. 4 mm). The results are in the accompanying data table.
The question are attached in a photo
A study of the amount of rainfall and the quantity of air pollution removed produced the following data shown in table below:
Daily Rainfall
x (0.01 cm)
Particulate Removed
y (μg/m3)
7
126
7.9
129.3
7.5
125.3
9.2
120.2
10.8
116.7
5.8
119.2
5.6
138.7
2.7
147.5
9.2
110.3
Plot a scatter diagram.
Find the equation of the regression line to predict (y) for the particulate removed from the amount of daily rainfall.
Chapter 11 Solutions
Basic Business Statistics Student Value Edition Plus NEW MyLab Statistics with Pearson eText -- Access Card Package (13th Edition)
Ch. 11 - An experiment has a single factor with five groups...Ch. 11 - You are working with the same experiment as in...Ch. 11 - You are working with the same experiment as in...Ch. 11 - Consider an experiment with three groups, with...Ch. 11 - Prob. 5PSCh. 11 - You are working the same experiment as in Problem...Ch. 11 - Prob. 7PSCh. 11 - The more costly and time-consuming it is to export...Ch. 11 - A hospital conducted a study of the waiting time...Ch. 11 - A manufacturer of pens has hired an advertising...
Ch. 11 - QSR has been reporting on the largest quick-serve...Ch. 11 - Prob. 12PSCh. 11 - A pet food company has a business objective of...Ch. 11 - A sporting goods manufacturing company wanted to...Ch. 11 - Prob. 15PSCh. 11 - Prob. 16PSCh. 11 - Prob. 17PSCh. 11 - Prob. 18PSCh. 11 - Prob. 19PSCh. 11 - Prob. 20PSCh. 11 - Prob. 21PSCh. 11 - Prob. 22PSCh. 11 - Prob. 23PSCh. 11 - How do the rating for TV, phone, and Internet...Ch. 11 - Prob. 25PSCh. 11 - How different are the rates of return of money...Ch. 11 - Prob. 27PSCh. 11 - The data in Concrsts2 represent the compressive...Ch. 11 - Prob. 29PSCh. 11 - Prob. 30PSCh. 11 - Prob. 31PSCh. 11 - Prob. 32PSCh. 11 - Prob. 33PSCh. 11 - Prob. 34PSCh. 11 - Prob. 35PSCh. 11 - Prob. 36PSCh. 11 - Prob. 37PSCh. 11 - Prob. 38PSCh. 11 - A metallurgy company wanted to investigate the...Ch. 11 - An experiment was conducted to try to resolve a...Ch. 11 - Prob. 41PSCh. 11 - Prob. 42PSCh. 11 - Prob. 43PSCh. 11 - Prob. 44PSCh. 11 - Prob. 45PSCh. 11 - When and how should you use multiple comparison...Ch. 11 - What is the difference between the randomized...Ch. 11 - Prob. 48PSCh. 11 - Prob. 49PSCh. 11 - Prob. 50PSCh. 11 - Prob. 51PSCh. 11 - Prob. 52PSCh. 11 - Medical wires are used in the manufacture of...Ch. 11 - Prob. 54PSCh. 11 - Suppose that, when setting up the experiment in...Ch. 11 - Prob. 56PSCh. 11 - Prob. 57PSCh. 11 - Prob. 58PSCh. 11 - Prob. 59PSCh. 11 - Prob. 60PSCh. 11 - Prob. 61PS
Knowledge Booster


Learn more about
Need a deep-dive on the concept behind this application? Look no further. Learn more about this topic, statistics and related others by exploring similar questions and additional content below.Similar questions
- Calcium is essential to tree growth because it promotes the formation of wood and maintains cell walls. In 1990, the concentration of calcium in precipitation in a certain area was 0.15 milligrams per liter (mg/L). A random sample of 10 precipitation dates in 2007 results in the following data table. Complete parts (a) through (c) below. Click the icon to view the data table. (a) State the hypotheses for determining if the mean concentration of calcium precipitation has changed since 1990. Но Ho: 0.15 mg/L H1: 0.15 mg/L i Data Table (b) Construct a 95% confidence interval about the sample mean concentration of calcium precipitation. The lower bound is The upper bound is (Round to four decimal places as needed.) 0.237 0.067 0.224 0.126 0.081 0.131 0.075 0.171 0.314 0.091 (c) Does the sample evidence suggest that calcium concentrations have changed since 1990? Print Done A. Yes, because the confidence interval does not contain 0.15 mg/L. B. Yes, because the confidence interval contains…arrow_forwardThe calcium (Ca) content of a powdered mineral substance was analyzed 10 times with the following percent compositions recorded:.0271 .0282 .0279 .0281 .0268.0271 .0281 .0269 .0275 .0276a. Draw a dotplot to describe the data. (HINT: The scale of the horizontal axis should range from .0260 to .0290.)b. Draw a stem and leaf plot for the data. Use the numbers in the hundredths and thousandths places as the stem.c. Are any of the measurements inconsistent with the other measurements, indicating that the technician may have made an error in the analysis?arrow_forwardThe scale of the correlation coefficient is: a. nominal b. ordinal c. ratioarrow_forward
- The amount of pollution produced by cars was measured for cars using gasoline containing different amounts of lead. A. Independent B. Dependentarrow_forwardCalculate P, for the following data relating to the height of the plants in a garden Heights (in cm) 10 - 15 0 - 5 5 - 10 15 - 20 20 - 25 25 - 30 No of plants 18 36 40 26 16 20arrow_forwardThe table below shows the results from the specific gravity (S.G.) test performed in a soil laboratory including twenty samples of sand. Determine the Coefficient of Quartile Variation.arrow_forward
- The mean arterial pressure (or MAP, average arterial pressure in one cardiac cycle) is a measure for perfusion status. You are interested to know if it is possible to predict an adult's MAP (Y) based on the body surface area (X). Suppose you randomly selected 50 adults, and measured their mean arterial blood pressure (in mmHg) & body surface area (in m2). The results are reflected below: I = 1.6 s, = 0.5 y = 80.1 s, = 16.9 r 0.8 %3D %3D (Source: Nall, R. (2018, April 10). Mean arterial pressure: Normal, low, high readings plus treatment. Retrieved from https://www.healthline.com/health/mean-arterlal-pressurel There is a 99.7% chance that the actual MAP of those with body surface area of 1.66 m2 falls between and OA) 61.5; 102.0 B) 58.9; 104.5 O C) 66.5; 96.9 O D) 71.6; 91.9 E) 51.3; 112.1arrow_forward. 3. 41°C 29 30 31 Why is it important to collect more than one set of data for each temperature? Why compute an average temperature?arrow_forwardThe spotted lanternfly, Lycorma delicatula, is an invasive species to the United States that has the potential to do significant agricultural damage. An ecologist is studying the relationship between the size of the female spotted lanternflies and the number of eggs they produce. The data are summarized below. Length of insect: AVG = 1 inch, SD = 0.15 inchNumber of eggs: AVG = 40 eggs, SD = 5 eggsr = 0.2 Using regression, we can say that the average number of eggs produced by female spotted lanternflies who are 1.1 inch long is closest to... Group of answer choices 42 39 40 41arrow_forward
- What type of association exists for these data? About how many miles per gallon would you expect for a 2000 pound vehicle?arrow_forwardThe following data refers to yield of tomatoes (kg/plot) for four different levels of salinity. Salinity level here refers to electrical conductivity (EC), where the chosen levels were EC = 1.6, 3.8, 6.0, and 10.2 nmhos/cm. (Use i = 1, 2, 3, and 4 respectively.) 1.6: 59.3 53.9 56.5 63.1 58.6 3.8: 55.4 59.9 52.2 54.6 6.0: 51.2 48.3 53.1 48.9 10.2: 44.7 48.2 41.1 47.1 46.9 Use the F test at level a = 0.05 to test for any differences in true average yield due to the different salinity levels. State the appropriate hypotheses. Hạ: at least two us are equal O Ho: H = z = 43 = Ha H: all four u,'s are unequal O Ho: H = uz = H3 - Ha Hạ: at least two 4's are unequal H: all four u,'s are equal Calculate the test statistic. (Round your answer to two decimal places.)arrow_forward
arrow_back_ios
arrow_forward_ios
Recommended textbooks for you
 Calculus For The Life SciencesCalculusISBN:9780321964038Author:GREENWELL, Raymond N., RITCHEY, Nathan P., Lial, Margaret L.Publisher:Pearson Addison Wesley,
 Functions and Change: A Modeling Approach to Coll...AlgebraISBN:9781337111348Author:Bruce Crauder, Benny Evans, Alan NoellPublisher:Cengage Learning
Calculus For The Life Sciences
Calculus
ISBN:9780321964038
Author:GREENWELL, Raymond N., RITCHEY, Nathan P., Lial, Margaret L.
Publisher:Pearson Addison Wesley,
Functions and Change: A Modeling Approach to Coll...
Algebra
ISBN:9781337111348
Author:Bruce Crauder, Benny Evans, Alan Noell
Publisher:Cengage Learning
The Shape of Data: Distributions: Crash Course Statistics #7; Author: CrashCourse;https://www.youtube.com/watch?v=bPFNxD3Yg6U;License: Standard YouTube License, CC-BY
Shape, Center, and Spread - Module 20.2 (Part 1); Author: Mrmathblog;https://www.youtube.com/watch?v=COaid7O_Gag;License: Standard YouTube License, CC-BY
Shape, Center and Spread; Author: Emily Murdock;https://www.youtube.com/watch?v=_YyW0DSCzpM;License: Standard Youtube License