
EP STATISTICS:ART+SCI...-MYLABSTATISTIC
4th Edition
ISBN: 9780135989029
Author: Agresti
Publisher: PEARSON CO
expand_more
expand_more
format_list_bulleted
Concept explainers
Videos
Textbook Question
Chapter 11, Problem 65CP
Clarity of diamonds Does the clarity of a diamond depend on its cut? Exercise 3.4 showed data, reproduced below, on the clarity (rated as internally flawless, IF. very very slightly included, VVS, very slightly included, VS, slightly included, SI and included. I) for the two lowest ratings for cut, which are “good” and “fair.”
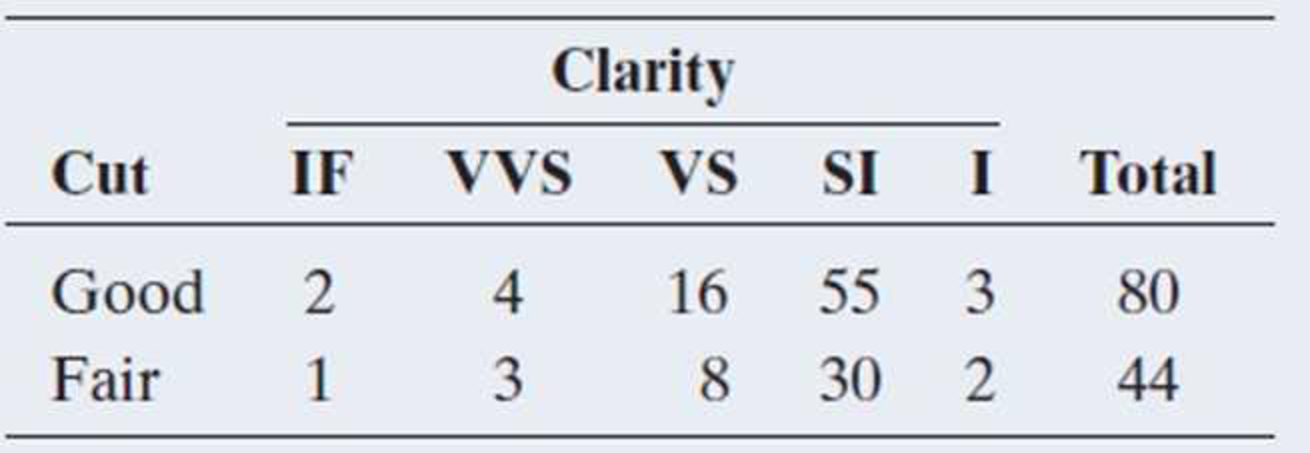
- a. Verify, using software, that X2 = 0.267 for this table. The (raw) data are available on the book’s website as Diamonds.csv.
- b. Can you use the chi-squared distribution to find a P-value? Why or why not?
- c. Of 10,000 random permutations. 9,908 resulted in an X2 value as large or larger than the one observed. Find the (approximate) permutation P-value and interpret.
- d. Use the Permutation Test of Independence web app accessible from the book’s website to enter the
contingency table and replicate the results from part c.
Expert Solution & Answer
Want to see the full answer?
Check out a sample textbook solution
Students have asked these similar questions
The Quick Sell car dealership has been using 1-minute spot ads on a local TV station. The ads always occur during the evening hours and advertise the different models and price ranges of cars on the lot that week. During a 10-week period, the Quick Sell dealer kept a weekly record of the number x of TV ads versus the number y of cars sold. The results are given in Table below. . ( Show your work--No work no credit)
x
y
6
15
20
31
0
10
14
16
25
28
16
20
28
40
18
25
10
12
8
15
Draw a scatter diagram for the data ( You can copy and past this graph in your work area by using any technology). Do you see a linear relation?
Compute the value of linear correlation coefficient "r". From the value of "r" can we decide the strength of the relation ( strong, moderate, or weak)?
Find the equation of regression line, identify the slope and intercept. Also explain meaning of slope in the context of the problem.
How many cars can the manager expect to sell if 12 ads per…
Consider the model y=-2.45x+7.18 derived from data between x=4 and x=10. What value of x represents interpolation of the data?
Eyeglassomatic manufactures eyeglasses for different retailers. They test to see how many defective lenses they made the time period of January 1 to March 31. The table gives the defect and the number of defects. Do the data support the notion that each defect type occurs in the same proportion? Test at the 5% level.
Number of Defective Lenses
Defect type
Number of defects
Scratch
1866
Right shaped - small
1935
Flaked
1979
Wrong axis
1921
Chamfer wrong
1864
Crazing, cracks
1991
Wrong shape
2004
Wrong PD
1895
Spots and bubbles
1917
Wrong height
1885
Right shape - big
1875
Lost in lab
1886
Spots/bubble - intern
1935
State the hypotheses.H0: Each defect type in the same proportion.Ha: Each defect type in the same proportion.
Calculate the χ2 test statistic. Round expected values to two decimal places. Round χ2 to three decimal places.χ2 =
Calculate the p-value. Round to four decimal places.p-value =
State your decision.Since p-value 0.05,…
Chapter 11 Solutions
EP STATISTICS:ART+SCI...-MYLABSTATISTIC
Ch. 11.1 - Gender gap in politics? In the United States, is...Ch. 11.1 - Prob. 2PBCh. 11.1 - Williams College admission Data from 2013 posted...Ch. 11.1 - Prob. 4PBCh. 11.1 - Marital happiness and income In the GSS, subjects...Ch. 11.1 - What is independent of happiness? Which one of the...Ch. 11.1 - Sample evidence about independence Refer to the...Ch. 11.2 - Life after death and gender In the 2012 GSS, 605...Ch. 11.2 - Happiness and gender For the 2 3 table on gender...Ch. 11.2 - Prob. 10PB
Ch. 11.2 - Marital happiness and income In Exercise 11.5 when...Ch. 11.2 - First and second free throw independent? In pro...Ch. 11.2 - Cigarettes and marijuana The table on the...Ch. 11.2 - Prob. 14PBCh. 11.2 - Help the environment In 2010 the GSS asked whether...Ch. 11.2 - Prob. 16PBCh. 11.2 - Aspirin and heart attacks A Swedish study used...Ch. 11.2 - z test for heart attack study Refer to the...Ch. 11.2 - Severity of fever after flu shot The study...Ch. 11.2 - Prob. 20PBCh. 11.2 - Testing a genetic theory In an experiment on...Ch. 11.2 - Birthdays by quarters Based on a random sample of...Ch. 11.2 - Checking a roulette wheel Karl Pearson devised the...Ch. 11.3 - Democrat, race, and gender The two tables show...Ch. 11.3 - Death penalty associations Table 11.10, summarized...Ch. 11.3 - Smoking and alcohol The table refers to a survey...Ch. 11.3 - Sex of victim and offender For murders in the...Ch. 11.3 - Smelling and mortality A recent study (Pinto et...Ch. 11.3 - Vioxx In September 2004, the pharmaceutical...Ch. 11.3 - Egg and cell derived vaccine When comparing the...Ch. 11.3 - Risk of dying for teenagers According to...Ch. 11.3 - Marital happiness The table shows 2012 GSS data on...Ch. 11.3 - Party ID and gender The table shows the 2012 GSS...Ch. 11.3 - Chi-squared versus measuring association For the...Ch. 11.4 - Standardized residuals for happiness and income...Ch. 11.4 - Prob. 36PBCh. 11.4 - Prob. 37PBCh. 11.4 - Prob. 38PBCh. 11.4 - Prob. 39PBCh. 11.4 - Prob. 40PBCh. 11.5 - Keeping old dogs mentally sharp In an experiment...Ch. 11.5 - Prob. 43PBCh. 11.5 - Prob. 44PBCh. 11.5 - Prob. 46PBCh. 11 - Female for president? When recent General Social...Ch. 11 - Prob. 48CPCh. 11 - Down and chi-squared For the data in the previous...Ch. 11 - Prob. 50CPCh. 11 - Prob. 51CPCh. 11 - Prob. 52CPCh. 11 - Prob. 53CPCh. 11 - Prob. 54CPCh. 11 - Prob. 55CPCh. 11 - Prob. 56CPCh. 11 - Seat belt helps? The table refers to passengers in...Ch. 11 - Prob. 58CPCh. 11 - Prob. 59CPCh. 11 - Prob. 60CPCh. 11 - Prob. 61CPCh. 11 - Prob. 62CPCh. 11 - Prob. 63CPCh. 11 - Prob. 64CPCh. 11 - Clarity of diamonds Does the clarity of a diamond...Ch. 11 - Benfords Law When looking at a collection of...Ch. 11 - Prob. 67CPCh. 11 - Prob. 68CPCh. 11 - Prob. 70CPCh. 11 - Prob. 71CPCh. 11 - Prob. 72CPCh. 11 - Prob. 73CPCh. 11 - Prob. 74CPCh. 11 - Prob. 75CPCh. 11 - Prob. 76CPCh. 11 - Prob. 77CPCh. 11 - Prob. 78CPCh. 11 - Prob. 79CPCh. 11 - Statistical versus practical significance In any...Ch. 11 - Prob. 81CPCh. 11 - Multiple response variables Each subject in a...Ch. 11 - Standardized residuals for 2 2 tables The table...Ch. 11 - Prob. 84CPCh. 11 - Prob. 85CPCh. 11 - Prob. 86CPCh. 11 - Prob. 87CPCh. 11 - Prob. 88CPCh. 11 - Voting with 16 A recent survey of Austrian high...
Knowledge Booster


Learn more about
Need a deep-dive on the concept behind this application? Look no further. Learn more about this topic, statistics and related others by exploring similar questions and additional content below.Similar questions
- Find the mean hourly cost when the cell phone described above is used for 240 minutes.arrow_forwardPlease indicate whether the above scatter plot indicates an r value that is: a. close to r=-1 b. close to r=+1 с. clearly negative but not near r = -1 d. clearly positive but not near r = +1arrow_forwardMatch the coefficient of determination to the scatter diagram. The scales on the x-axis and y-axis are the same for each scatter diagram. (a) R = 1. (b) R = 0.62. (c) R = 0.94 Explanatory (a) Scatter diagram (b) Scatter diagram (c) Scatter diagram Explanatory Explanatory asuodsoy oSuodsay Responsearrow_forward
- sniparrow_forwardThe data below shows the maximum temperature(°c) and the number of bowls of soup sold at God's Grace canteen on the eleven randomly selected days last year. 1. On a graph paper, draw a scatter plot of temperature against bowls sold to represent the data using a scale of 1cm to represent 5bowls and 2cm to represent 5°C. 2.Find the mean maximum temperature, y of soup recorded 3.Plot and label point M(x, y) on the scatter diagram 4.the line of best fit for the data passes through the point M and the y-intercept (0.33.2).Draw this line on your graph 5.find the equation of the line of best fit. 6.on another day of the year, the temperature was 20°C. Using the equation of the line of best fit, estimate the number of bowls of soup sold on that day. 7.the shop owner says "we sell more bowls of soup the higher the temperature". Does the scatter graph support this statement? Give a reason for your answer.arrow_forwardPlease answer... I'm needed only 1 hours time to dd .... Thank uarrow_forward
- state whether the parameter of interest is a mean or a proportion: a survey reports that local t news has shown a 17% increase in revenue within a two year period while newspaper revenues decreased by 6.4% during this time period.arrow_forwardLet the height data represent sample. Use an appropriate statistical test to check whether the population mean is different from 170 cm.Use α = 0.05.Also, write a substantive conclusion and explanation. Use an appropriate graph to check if data is normally distributed. Do it in R commander. This si part of my data:arrow_forwardMatch the coefficient of determination to the scatter diagram. The scales on the x-axis and y-axis are the same for each scatter diagram. (a) R? = 0.12, (b) R2 = 0.98, (c) R? = 0.58 (a) Scatter diagram Eplantory (b) Scatter diagram (e) Scatter diagram Esplanatory II Eplanatoryarrow_forward
- A real estate agency collects the data in the following table concerning y = sales price of a house (in thousands of dollars) xl = home size (in hundreds of square feet) x2 = rating (an overall "niceness rating" for the house expressed on a scale from 1 [worst] to 10 [best], and provided by the real estate agency) Sales Price, Home Size, Rating, y (x $1000) X, (× 100 ft³) X2 180 98.1 173.1 136.5 23 11 20 17 141 15 8 165.9 21 4 193.5 127.8 163.5 172.5 24 13 19 25 The agency wishes to develop a regression model that can be used to predict the sales prices of future houses it will list. Use software of your choice to fit the 2 following models. Then answer the same questions (a-e) for both models. Modell: у %3 Во + Bix, + Bгх2 + € Model2: y = Bo + B1x1 + B2x2 + B3x² + e (a) Discuss why scatter plot of y vs x, and x2 indicate that this model might be reasonable. (b) Interpret the regression coefficients (c) Test significance of each individual coefficients. (d) Test overall regression…arrow_forwardDatasetD 1 72 16 85 2 96 17 97 28 18 20 4 27 76 19 49 43 20 69 7 21 97 8 9. 22 34 10 85 23 43 11 52 12 46 24 36 13 79 25 58 14 46 26 15 15 74 31 21 27 3.arrow_forwardMatch the coefficient of determination to the scatter diagram. The scales on the x-axis and y-axis are the same for each scatter diagram. (a) R? = 0.94, (b) R? = 0.27, (c) R? = 1 (a) Scatter diagram Explanatory (b) Scatter diagram (c) Scatter diagram Explanatory II Explanatory Response Respose OSuodsayarrow_forward
arrow_back_ios
SEE MORE QUESTIONS
arrow_forward_ios
Recommended textbooks for you
 Algebra & Trigonometry with Analytic GeometryAlgebraISBN:9781133382119Author:SwokowskiPublisher:Cengage
 Big Ideas Math A Bridge To Success Algebra 1: Stu...AlgebraISBN:9781680331141Author:HOUGHTON MIFFLIN HARCOURTPublisher:Houghton Mifflin Harcourt
 Trigonometry (MindTap Course List)TrigonometryISBN:9781337278461Author:Ron LarsonPublisher:Cengage Learning
 Glencoe Algebra 1, Student Edition, 9780079039897...AlgebraISBN:9780079039897Author:CarterPublisher:McGraw Hill
 Holt Mcdougal Larson Pre-algebra: Student Edition...AlgebraISBN:9780547587776Author:HOLT MCDOUGALPublisher:HOLT MCDOUGAL
Algebra & Trigonometry with Analytic Geometry
Algebra
ISBN:9781133382119
Author:Swokowski
Publisher:Cengage
Big Ideas Math A Bridge To Success Algebra 1: Stu...
Algebra
ISBN:9781680331141
Author:HOUGHTON MIFFLIN HARCOURT
Publisher:Houghton Mifflin Harcourt
Trigonometry (MindTap Course List)
Trigonometry
ISBN:9781337278461
Author:Ron Larson
Publisher:Cengage Learning
Glencoe Algebra 1, Student Edition, 9780079039897...
Algebra
ISBN:9780079039897
Author:Carter
Publisher:McGraw Hill
Holt Mcdougal Larson Pre-algebra: Student Edition...
Algebra
ISBN:9780547587776
Author:HOLT MCDOUGAL
Publisher:HOLT MCDOUGAL
The Shape of Data: Distributions: Crash Course Statistics #7; Author: CrashCourse;https://www.youtube.com/watch?v=bPFNxD3Yg6U;License: Standard YouTube License, CC-BY
Shape, Center, and Spread - Module 20.2 (Part 1); Author: Mrmathblog;https://www.youtube.com/watch?v=COaid7O_Gag;License: Standard YouTube License, CC-BY
Shape, Center and Spread; Author: Emily Murdock;https://www.youtube.com/watch?v=_YyW0DSCzpM;License: Standard Youtube License