
Videos
In Exercises 1.7–1.12, classify each of the studies as either descriptive or inferential. Explain your answers.
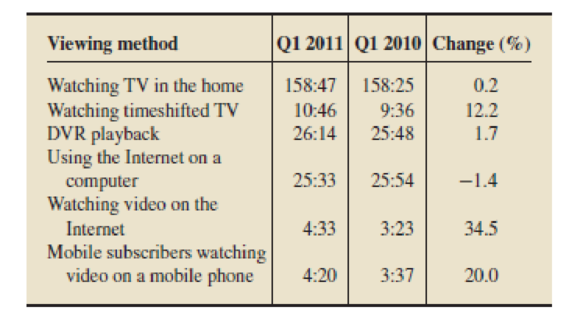
1.7 TV Viewing Times. Data from a sample of Americans yielded the following estimates of average TV viewing time per month for all Americans 2 years old and older. The times are in hours and minutes; Q1 stands for first quarter. [SOURCE: The Cross-Platform Report, Quarter 1, 2011. Published by The Nielsen Company, © 2011.]
Want to see the full answer?
Check out a sample textbook solution
Chapter 1 Solutions
Introductory Statistics, Books a la Carte Plus NEW MyLab Statistics with Pearson eText -- Access Card Package (10th Edition)
Additional Math Textbook Solutions
Business Statistics: A First Course (7th Edition)
Basic Business Statistics, Student Value Edition
Intro Stats, Books a la Carte Edition (5th Edition)
Elementary Statistics: Picturing the World (6th Edition)
Essential Statistics
Elementary Statistics: Picturing the World (7th Edition)


 Glencoe Algebra 1, Student Edition, 9780079039897...AlgebraISBN:9780079039897Author:CarterPublisher:McGraw Hill
 Holt Mcdougal Larson Pre-algebra: Student Edition...AlgebraISBN:9780547587776Author:HOLT MCDOUGALPublisher:HOLT MCDOUGAL
 Big Ideas Math A Bridge To Success Algebra 1: Stu...AlgebraISBN:9781680331141Author:HOUGHTON MIFFLIN HARCOURTPublisher:Houghton Mifflin Harcourt