
Concept explainers
Videos
A company produces to a seasonal demand, with the
- a. What is the cost of carrying inventory for the month of January for the level strategy?
- b. What is the total cost of the level strategy including regular time, inventory carrying cost and changes in production level?
- c. What is the total cost of the chase strategy?
a)
To determine: The inventory carrying cost for the month of January for the level strategy.
Introduction:
The aggregate plan is the output of sales and operations planning. The major concern of aggregate planning is the production time and quantity for the intermediate future. There are three kinds of aggregate planning; they are level strategy, chase strategy, and mixed strategy.
Explanation of Solution
Given information:
The present labor force can produce 500 units per month, and the demand with the forecast for the next 12 months is given below:
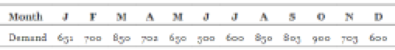
| Month | Demand |
| J | 651 |
| F | 700 |
| M | 850 |
| A | 702 |
| M | 650 |
| J | 500 |
| J | 600 |
| A | 850 |
| S | 803 |
| O | 900 |
| N | 703 |
| D | 600 |
Each employee can produce 20 units per month and is paid $2,000 per month. Inventory carrying cost is given as $50 per unit per year. Changes in the production level is $100 per unit during line changeover costs, hiring, and layoffs. Initial inventory is given as 200 units.
Determine the inventory for 12 months:
| Month | Demand | Production | Inventory |
| J | 651 | 709.08 | 258.08 |
| F | 700 | 709.08 | 267.17 |
| M | 850 | 709.08 | 126.25 |
| A | 702 | 709.08 | 133.33 |
| M | 650 | 709.08 | 192.42 |
| J | 500 | 709.08 | 401.50 |
| J | 600 | 709.08 | 510.58 |
| A | 850 | 709.08 | 369.67 |
| S | 803 | 709.08 | 275.75 |
| O | 900 | 709.08 | 84.83 |
| N | 703 | 709.08 | 90.92 |
| D | 600 | 709.08 | 200.00 |
| Total | 8509 | 8509.00 | 2910.50 |
Computation of inventory for 12 months:
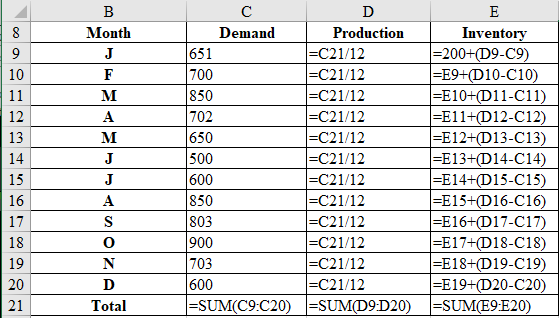
Determine the cost of carrying inventory for the month of January for the level strategy:
It is calculated by multiplying the inventory for the month of January (refer table), and the value is attained by dividing inventory carrying cost and number of months.
Hence, the inventory carrying cost is $1,075.33.
b)
To determine: The total cost of level strategy.
Introduction:
The aggregate plan is the output of sales and operations planning. The major concern of aggregate planning is the production time and quantity for the intermediate future. There are three kinds of aggregate planning; they are level strategy, chase strategy, and mixed strategy.
Explanation of Solution
Given information:
The current labor force can produce 500 units per month, and the demand with the forecast for the next 12 months is given below:
| Month | Demand |
| J | 651 |
| F | 700 |
| M | 850 |
| A | 702 |
| M | 650 |
| J | 500 |
| J | 600 |
| A | 850 |
| S | 803 |
| O | 900 |
| N | 703 |
| D | 600 |
Each employee can produce 20 units per month and is paid $2,000 per month. Inventory carrying cost is given as $50 per unit per year. Deviations in the production level is $100 per unit during line changeover costs, hiring, and layoffs. Initial inventory is given as 200 units.
Determine the regular time cost:
It is calculated by multiplying production units, number of months, and changes in the production level cost.
Hence, the regular time cost is $850,896.
Determine the inventory carrying cost:
It is computed by multiplying the sum of inventory (refer table), and the value is attained by dividing inventory carrying cost and number of months.
Determine the change in production level:
It is calculated by multiplying the changes in the production line and the difference between regular production per month and the calculated production.
Determine the total cost of level strategy:
It is calculated by adding regular time cost, inventory carrying cost, and change in production level cost.
Hence, the total cost of level strategy is $883,923.08.
c)
To determine: The total cost of chase strategy.
Introduction:
The aggregate plan is the output of sales and operations planning. The major concern of aggregate planning is the production time and quantity for the intermediate future. There are three kinds of aggregate planning; they are level strategy, chase strategy, and mixed strategy.
Explanation of Solution
Given information:
The current labor force can produce 500 units per month, and the demand with the forecast for the next 12 months is given below:
| Month | Demand |
| J | 651 |
| F | 700 |
| M | 850 |
| A | 702 |
| M | 650 |
| J | 500 |
| J | 600 |
| A | 850 |
| S | 803 |
| O | 900 |
| N | 703 |
| D | 600 |
Each employee can produce 20 units per month and is paid $2,000 per month. Inventory carrying cost is given as $50 per unit per year. Changes in the production level is $100 per unit during line changeover costs, hiring, and layoffs. Initial inventory is given as 200 units.
Determine the inventory for 12 months:
| Month | Demand | Production | Inventory | Change in production level |
| J | 651 | 651 | 200 | 151 |
| F | 700 | 700 | 200 | 49 |
| M | 850 | 850 | 200 | 150 |
| A | 702 | 702 | 200 | 148 |
| M | 650 | 650 | 200 | 52 |
| J | 500 | 500 | 200 | 150 |
| J | 600 | 600 | 200 | 100 |
| A | 850 | 850 | 200 | 250 |
| S | 803 | 803 | 200 | 47 |
| O | 900 | 900 | 200 | 97 |
| N | 703 | 703 | 200 | 197 |
| D | 600 | 600 | 200 | 103 |
| Total | 8509 | 8509 | 2400 | 1494 |
Computation of inventory for 12 months:
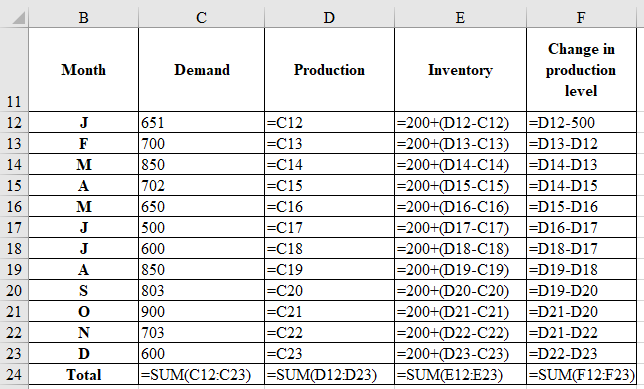
Determine the regular time cost:
It is computed by multiplying production units, number of months, and changes in the production level cost.
Hence, the regular time cost is $850,900.
Determine the inventory carrying cost:
It is calculated by multiplying the sum of inventory (refer table), and the value is attained by dividing inventory carrying cost and number of months.
Determine the change in production level:
It is calculated by multiplying the sum of changes in the production level and cost of change in production line.
Determine the total cost of chase strategy:
It is calculated by adding regular time cost, inventory carrying cost, and change in production level cost.
Hence, the total cost of chase strategy is $1,010,300.
Want to see more full solutions like this?
Chapter 11 Solutions
OPERATIONS MANAGEMENT IN THE SUPPLY CHAIN: DECISIONS & CASES (Mcgraw-hill Series Operations and Decision Sciences)


- Assume the demand for a companys drug Wozac during the current year is 50,000, and assume demand will grow at 5% a year. If the company builds a plant that can produce x units of Wozac per year, it will cost 16x. Each unit of Wozac is sold for 3. Each unit of Wozac produced incurs a variable production cost of 0.20. It costs 0.40 per year to operate a unit of capacity. Determine how large a Wozac plant the company should build to maximize its expected profit over the next 10 years.arrow_forwardThe Tinkan Company produces one-pound cans for the Canadian salmon industry. Each year the salmon spawn during a 24-hour period and must be canned immediately. Tinkan has the following agreement with the salmon industry. The company can deliver as many cans as it chooses. Then the salmon are caught. For each can by which Tinkan falls short of the salmon industrys needs, the company pays the industry a 2 penalty. Cans cost Tinkan 1 to produce and are sold by Tinkan for 2 per can. If any cans are left over, they are returned to Tinkan and the company reimburses the industry 2 for each extra can. These extra cans are put in storage for next year. Each year a can is held in storage, a carrying cost equal to 20% of the cans production cost is incurred. It is well known that the number of salmon harvested during a year is strongly related to the number of salmon harvested the previous year. In fact, using past data, Tinkan estimates that the harvest size in year t, Ht (measured in the number of cans required), is related to the harvest size in the previous year, Ht1, by the equation Ht = Ht1et where et is normally distributed with mean 1.02 and standard deviation 0.10. Tinkan plans to use the following production strategy. For some value of x, it produces enough cans at the beginning of year t to bring its inventory up to x+Ht, where Ht is the predicted harvest size in year t. Then it delivers these cans to the salmon industry. For example, if it uses x = 100,000, the predicted harvest size is 500,000 cans, and 80,000 cans are already in inventory, then Tinkan produces and delivers 520,000 cans. Given that the harvest size for the previous year was 550,000 cans, use simulation to help Tinkan develop a production strategy that maximizes its expected profit over the next 20 years. Assume that the company begins year 1 with an initial inventory of 300,000 cans.arrow_forwardIt costs a pharmaceutical company 75,000 to produce a 1000-pound batch of a drug. The average yield from a batch is unknown but the best case is 90% yield (that is, 900 pounds of good drug will be produced), the most likely case is 85% yield, and the worst case is 70% yield. The annual demand for the drug is unknown, with the best case being 20,000 pounds, the most likely case 17,500 pounds, and the worst case 10,000 pounds. The drug sells for 125 per pound and leftover amounts of the drug can be sold for 30 per pound. To maximize annual expected profit, how many batches of the drug should the company produce? You can assume that it will produce the batches only once, before demand for the drug is known.arrow_forward
- Wine Accessories Inc. (WAI) produces two models of corkscrews, the standard model and a deluxe model. WAI follows a level aggregate plan, producing 20,000 corkscrews per month, or 5000 corkscrews per week. Th e MPS is developed in weekly time periods. Th e forecasts for each model and the projected available are shown in the next two tables. Th e replenishment order quantity is 2000 units for the standard model and 1000 units for the deluxe model. Note that you can place multipleorders if a single order is insuffi cient to cover the forecast (you can produce 4000 units of the standard model if necessary, or 2000 or 3000 units of the deluxe model). Remember that total weekly production is limited to 5000 corkscrews. Develop an MPS for each of the products.arrow_forwardA company manufactures tables and chairs. Each table and chair must be made entirely out of oak or entirely out of pine. A total of 150 board ft of oak are available. A table requires 17 board ft of oak, and a chair requires 5 board ft of oak. Each table can be sold for $40, and each chair for $15. A LP model has been formulated to help the company determine the production plan that maximizes revenue. Please draw a flow chart for the programarrow_forwardI need a detailed assistance to solve this problem in: Operations Analysis. #4) A greengrocer has exactly 1,000 square feet available to display and sells 3 kinds of vegetables. The space consumed by each kind of vegetable is proportional to its cost, and tomatoes consume 0.5 square feet per pound. There is a $100 setup cost for replenishing any of the vegetables, and the interest rate is 25% per annum. The 3 vegetables for sale have the following data: Tomatoes: annual demand is 850 pounds and the cost per pound is $0.29. Lettuce: annual demand is 1280 pounds and the cost per pound is $0.45. Zucchini: annual demand is 630 pounds and the cost per pound is $0.25. a) - What is the optimal quantity for purchasing each vegetable (include all formulas)?arrow_forward
- Northwest Pipe (NP) makes water pipe. NP is planningproduction for the next seven months, March through September.Th e forecast demands (in thousands of feet) are, respectively, 40,60, 70, 80, 90, 100, and 80. NP can make 75,000 feet of pipe permonth using regular-time production, at a cost of $1.25 per foot.Th ey can make up to an additional 15,000 feet using overtimeproduction at a cost of $1.50 per foot. Any pipe made in onemonth and sold in a later month incurs an inventory holding costof $0.15 per foot, per month. NP expects to end February with5000 feet of pipe and would like to plan to end September with10,000 feet in inventory. NP would like to plan their productionschedule to minimize total cost during the next seven months. (a) Formulate an LP to minimize total costs.(b) Set up and solve the problem on a spreadsheet.(c) What is the optimal solution? Explain the rationale for thesolutionarrow_forwardA plant operation has fixed cost of $2,000,000 per year, and its output capacity is 100,000 electrical appliances per year. The variable cost is $70 per unit, and the product sells for $120 per unit. a) What is the annual break even volume of this product? b) Compare annual profit when the plant is operating at 90% capacity with the plant operation at 100% capacity. Assume that the first 90% of capacity output is sold at $120 per unit and that the remaining 10% of production is sold at $100 per unit. Show handwritten solutionsarrow_forwardDemand for a product is forecasted for the six periods is 263, 256, 301, 312, 304, and 294 respectively. If a CHASE DEMAND strategy is adopted, and the regular production cost is RO 12 per unit with a maximum regular production of 280 units per period. While, the overtime and subcontract costs are RO 20 and RO 25 per unit respectively, There is no limit on subcontracting: however, maximum overtime production capacity is 10. Average inventory holding cost is RO 5 per unit per period. How many units in total are held as inventory? Select one Oa 40 Ob 51 Oco Od None is correct Oe. 1629arrow_forward
- A local canning company sells canned vegetables to a supermarket chain in the Minneapolis area. A typical case of canned vegetables requires an average of 0.2 day of labor to produce. The aggregate inventory on hand at the end of June is 800 cases. The demand for the vegetables can be accurately predicted for about 18 months based on orders received by the firm. The predicted demands for the next 18 months are as follows: (given) The firm currently has 25 workers. The cost of hiring and training a new worker is $1,000, and the cost to lay off one worker is $1,500. The firm estimates a cost of $2.80 to store a case of vegetables for a month. They would like to have 1,500 cases in inventory at the end of the 18-month planning horizon. a. Develop a spreadsheet to find a plan that hires and fires workers monthly in order to minimize inventory costs. Determine the total cost of that plan as well.arrow_forwardThe Scottville "Mill" produces five different fabrics. Each fabric can be woven on one or more of the mill's 38 looms. The sales department has forecast demand for the next month. The demand data are shown in Table 1.0 below along with data on the selling price per yard, variable cost per yard, and purchase price per yard. The mill operates 24 hours a day and is scheduled for 30 days during the coming month. The Mill has two types of looms: dobbie and regular. The dobbie looms are more versatile and can be used for all five fabrics. The regular looms can produce only three of the fabrics. The Mill has a total of 38 looms: 8 are dobbie and 30 are regular. The rate of production for each fabric on each type of loom is given in Table 1.1. The time to change over from producing one fabric to another is negligible and does not have to be considered. The Scottsville Mill satisfies all demand with either its own fabric or fabric purchased from another mill. Fabrics that cannot be woven at…arrow_forwardSuzie’s Sweatshirts is a home-based company that makes upscale, hand-painted sweatshirts for children. Forecasts of sales for the next year are Autumn: 125 Winter: 350 Spring: 75 Each Shirt is sold for $15. The holding cost per shirt is 6% of the selling price per quarter. The shirts are painted by part-time workers who earn $4.50 per hour during the autumn. Because of the high demand for part-time help during the winter holiday season, labor rates are higher in the winter, and Suzie must pay the workers $6.00 per hour. In the spring, labor is more difficult to keep, and Suzie finds that she must pay $5.50 per hour to get qualified help. Each shirt takes 1.5 hours to complete. Formulate the problem to a LP model to help Suzie plan production over the three quarters to minimize the combined production and inventory holding cost. Suppose there is no inventory at the beginning of the autumn. (Note: You do not need to solve the model.)arrow_forward
 Practical Management ScienceOperations ManagementISBN:9781337406659Author:WINSTON, Wayne L.Publisher:Cengage,