
CORPORATE FINANCE--CONNECT ACCESS CARD
12th Edition
ISBN: 9781264807475
Author: Ross
Publisher: MCG CUSTOM
expand_more
expand_more
format_list_bulleted
Videos
Textbook Question
Chapter 11, Problem 8QAP
Returns and Standard Deviations Consider the following information:
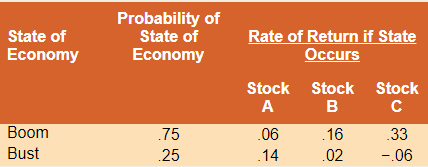
a. What is the expected return on an equally weighted portfolio of these three stocks?
b. What is the variance of a portfolio invested 20 percent each in A and B and 60 percent in C?
Expert Solution & Answer
Want to see the full answer?
Check out a sample textbook solution
Students have asked these similar questions
Assume that the covariance between Stock A and Stock B is -28%^2 (0.0028). Compute the expected rate of return and variance of rate of return of Donald’s portfolio.
Portfolios A and B are both well-diversified. The risk-free rate is 8%. The return for the market is 10%.
Portfolio A has an expected return of 15% and beta of 1.1. Portfolio B has an expected return of 9% and beta
of 0.20. Portfolio A's variance is 9%, whilst Portfolio B's variance is 5.5%.
Calculate for Portfolio A and Portfolio B the following:
1. Sharpe's Measure,
2. Treynor's Measure,
3. Jensen's Measure.
Which is the better portfolio according to each measure?
Calculate the correlation coefficient for the portfolio using the following information:
Variance of Stock X 0.08 Variance of Stock Y 0.06
Covariance is 0.05
a. 0.1042
b. 0.7217
c. 0.00024
d. 0.0693
Chapter 11 Solutions
CORPORATE FINANCE--CONNECT ACCESS CARD
Ch. 11 - Diversifiable and Nondiversifiable Risks In broad...Ch. 11 - Systematic versus Unsystematic Risk Classify the...Ch. 11 - Expected Portfolio Returns If a portfolio has a...Ch. 11 - Diversification True or false: The most important...Ch. 11 - Portfolio Risk If a portfolio has a positive...Ch. 11 - Beta and CAPM Is it possible that a risky asset...Ch. 11 - Covariance Briefly explain why the covariance of a...Ch. 11 - Prob. 8CQCh. 11 - Prob. 9CQCh. 11 - Prob. 10CQ
Ch. 11 - Determining Portfolio Weights What are the...Ch. 11 - Portfolio Expected Return You own a portfolio that...Ch. 11 - Prob. 3QAPCh. 11 - Portfolio Expected Return You have 10,000 to...Ch. 11 - Prob. 5QAPCh. 11 - Prob. 6QAPCh. 11 - Calculating Expected Returns A portfolio is...Ch. 11 - Returns and Standard Deviations Consider the...Ch. 11 - Returns and Standard Deviations Consider the...Ch. 11 - Calculating Portfolio Betas You own a stock...Ch. 11 - Calculating Portfolio Betas You own a portfolio...Ch. 11 - Using CAPM A stock has a beta of 1.15, the...Ch. 11 - Prob. 13QAPCh. 11 - Prob. 14QAPCh. 11 - Prob. 15QAPCh. 11 - Using CAPM A stock has a beta of 1.08 and an...Ch. 11 - Prob. 17QAPCh. 11 - Reward-to-Risk Ratios Stock Y has a beta of 1.15...Ch. 11 - Prob. 19QAPCh. 11 - Portfolio Returns Using information from the...Ch. 11 - Prob. 21QAPCh. 11 - Prob. 22QAPCh. 11 - Analyzing a Portfolio You want to create a...Ch. 11 - Prob. 24QAPCh. 11 - Prob. 25QAPCh. 11 - Prob. 26QAPCh. 11 - Prob. 27QAPCh. 11 - Prob. 28QAPCh. 11 - Prob. 29QAPCh. 11 - Prob. 30QAPCh. 11 - Prob. 31QAPCh. 11 - Prob. 32QAPCh. 11 - Prob. 33QAPCh. 11 - Prob. 34QAPCh. 11 - Prob. 35QAPCh. 11 - Prob. 36QAPCh. 11 - Prob. 37QAPCh. 11 - Prob. 38QAPCh. 11 - Prob. 1MCCh. 11 - Prob. 2MC
Knowledge Booster


Learn more about
Need a deep-dive on the concept behind this application? Look no further. Learn more about this topic, finance and related others by exploring similar questions and additional content below.Similar questions
- (c) Consider information given in the table below and answers the question asked thereafter: i. Calculate expected return on each stock? On the basis of this measure, which stock you will choose?ii. Calculate standard deviation of the returns on each stock? On the basis of this measure, which stock you will choose?iii. Calculate coefficient of variance of the returns on each stock? On the basis of this measure, which stock you will choose?iv. Calculate covariance and coefficient of correlation between the returns of the stocks A and B.v. Now suppose you have $100,000 to invest and you want to a hold a portfolio comprising of $35,000 invested in stock A and remaining amount in stock B. Calculate risk and return of your portfolio. (d) Firm A reports a Profit Margin of 6.5% and a Total Asset Turnover Ratio of 3.25. Their total asset level is $8,500,000. Assume there are 700,000 shares outstanding and the PE ratio is 11. Also, assume the Return on Equity is 16%. Based on this, calculate…arrow_forwardThe standard deviation of the returns of a portfolio is the geometric average of the standard deviation of the returns of the individual assets in the portfolio is none of the other options is the square root of the expected return of the portfolio is the weighted average of the standard deviation of the returns of the individual assets in the portfolio is the simple average of the standard deviation of the returns of the individual assets in the portfolio costsarrow_forwardMean returns for portfolios are calculated by taking the weighted average of the mean returns for each investment in the portfolio. Why won’t this approach work calculate the standard deviation of portfolio returns?arrow_forward
- The probability distribution of returns for the two stocks X and Y are as follows: Probability 0.1 0.3 0.05 0.25 0.15 0.15 For each of the two stocks, calculate: a. The expected return. b. Variance of returns c. Volatility of returns. Stock X 0.05 -0.1 0.08 -0.08 0.20 0.12 Return Stock Y 0.13 0,04 -0.12 0.21 0.1 -0.05arrow_forwardA person is interested in constructing a portfolio. Two stocks are being considered. Letx = percent return for an investment in stock 1, and y = percent return for an investment instock 2. The expected return and variance for stock 1 are e(x) = 8.45% and Var(x) = 25.The expected return and variance for stock 2 are e(y) = 3.20% and Var(y) = 1. Thecovariance between the returns is sxy = −3.a. what is the standard deviation for an investment in stock 1 and for an investment instock 2? Using the standard deviation as a measure of risk, which of these stocks isthe riskier investment?arrow_forwardSuppose that the capital asset pricing model (CAPM) applies. The risk premium of a stock is 3 percent and the risk premium of the market portfolio is 2. The standard deviation of the market portfo- lio is 6. Compute the covariance between the stock and the market portfolio.arrow_forward
- how do you calculate a stocks average monthly return,its return variance ,standard deviation and beta? what is the formulaarrow_forwardUsing the stock price data for any two companies provided below carry out the following tasks: 1.Compute, for each asset: i.Total Returns ii.Expected returns iii.standard deviation iv.Correlation Coefficient 2.Construct the variance-covariance matrix 3.Construct equally weighted portfolio and calculate Expected Return, Standard Deviation and Sharpe ratio. 4.Reconstruct equally weighted portfolio and calculate Expected Return, Standard Deviation and Sharpe ratio. 5.Use Solver to determine optimal risky portfolio. 6.Create hypothetical portfolios (commencing from Weight A=0 and weight B=100) 7.Calculate Expected return and Standard Deviation for all the above combinations 8.Graph the efficient frontier 9.Graph the optimal portfolio 10.Assuming that the investors prefers lower level of risk than what a portfolio of risky assets offer, introduce a risk free asset in the portfolio with a return of 3% 11.Using hypothetical weights (A= Portfolio of Risky Assets, B= 1 Risk Free…arrow_forwardSuppose the index model for stocks A and B is estimated with the following results:rA = 2% + 0.8RM + eA, rB = 2% + 1.2RM + eB , σM = 20%, and RM = rM − rf . The regressionR2 of stocks A and B is 0.40 and 0.30, respectively.(a) What is the variance of each stock? (b) What is the firm-specific risk of each stock? (c) What is the covariance between the two stocks?arrow_forward
- From the following information, calculate covariance between stocks A and B and expected return and risk of a portfolio in which A and B are equally weighted.Which stock would be best recommend if investment in individual stock is to be made? Justify the answer using numerical calculations. Stock A Stock B Expected return 24% 35% Standard deviation 12% 18% Coefficient of correlation 0.65arrow_forwardWhat is the standard deviation of the following portfolio if the coefficient of the correlation between the two securities is equl to 0.5? Variance % Proportion of investment in the portfolio security 1 10 0.3 security 2 20 0.7arrow_forwardExpected return and standard deviation. Use the following information to answer the questions: a. What is the expected return of each asset? b. What is the variance and the standard deviation of each asset? c. What is the expected return of a portfolio with 12% in asset J, 52% in asset K, and 36% in asset L? d. What is the portfolio's variance and standard deviation using the same asset weights from part (c)? Hint: Make sure to round all intermediate answers you will type. a. What is the expected return of asset J? (Round to four decimal places.) Data table (Click on the following icon in order to copy its contents into a spreadsheet.) Return on Asset J in State of Economy Boom Growth Stagnant Recession Probability of State 0.24 0.36 0.21 0.19 State 0.050 0.050 0.050 0.050 Return on Asset K in State 0.230 0.120 0.020 -0.060 Return on Asset L in State 0.250 0.190 0.065 - 0.190arrow_forward
arrow_back_ios
SEE MORE QUESTIONS
arrow_forward_ios
Recommended textbooks for you
 EBK CONTEMPORARY FINANCIAL MANAGEMENTFinanceISBN:9781337514835Author:MOYERPublisher:CENGAGE LEARNING - CONSIGNMENT
 Intermediate Financial Management (MindTap Course...FinanceISBN:9781337395083Author:Eugene F. Brigham, Phillip R. DavesPublisher:Cengage Learning
EBK CONTEMPORARY FINANCIAL MANAGEMENT
Finance
ISBN:9781337514835
Author:MOYER
Publisher:CENGAGE LEARNING - CONSIGNMENT
Intermediate Financial Management (MindTap Course...
Finance
ISBN:9781337395083
Author:Eugene F. Brigham, Phillip R. Daves
Publisher:Cengage Learning
Investing For Beginners (Stock Market); Author: Daniel Pronk;https://www.youtube.com/watch?v=6Jkdpgc407M;License: Standard Youtube License