The majority of American adults use their smartphones to go online. The bar graph shows the percentage of American using phones to go online from 2009 through 2013. Source: Pew Internet and American Life Project The data in the graph can be modeled by the formula S = 32 + 8.7 x − 0.3 x 2 , where S represents the percentage of American adults using smartphones to go online x years after 2009. Use this formula to solve Exercises 93 –94 . According to the formula, what percentage of American adults used smartphones to go online in 2013? Does this underestimate or overestimate the actual percent shown by the bar graph? By how much? The formula C = 5 9 ( F − 32 )
The majority of American adults use their smartphones to go online. The bar graph shows the percentage of American using phones to go online from 2009 through 2013. Source: Pew Internet and American Life Project The data in the graph can be modeled by the formula S = 32 + 8.7 x − 0.3 x 2 , where S represents the percentage of American adults using smartphones to go online x years after 2009. Use this formula to solve Exercises 93 –94 . According to the formula, what percentage of American adults used smartphones to go online in 2013? Does this underestimate or overestimate the actual percent shown by the bar graph? By how much? The formula C = 5 9 ( F − 32 )
Solution Summary: The author calculates the percentage of American adults who used smart phones to go online in 2012 according to the formula.
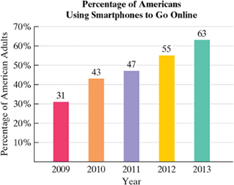
The majority of American adults use their smartphones to go online. The bar graph shows the percentage of American using phones to go online from 2009 through 2013.
Source: Pew Internet and American Life Project
The data in the graph can be modeled by the formula
S
=
32
+
8.7
x
−
0.3
x
2
,
where S represents the percentage of American adults using smartphones to go online x years after 2009. Use this formula to solveExercises 93 –94.
According to the formula, what percentage of American adults used smartphones to go online in 2013? Does this underestimate or overestimate the actual percent shown by the bar graph? By how much?
A sample of 425 voters aged 18 – 25 were asked whether they thought Social Security benefits should be increased for people over the age of 65. A total of 181 of them answered yes. A sample of 500 voters aged 60 and older were asked the same question and 234 of them answered yes. Can you support the claim that the proportion of voters who support an increase in Social Security benefits is less among younger votes? Use ? = 0.05.
Suppose classmates who graduated in 2004 compared their median incomes ten years later. The bar graph displays the median income, in thousands of dollars, for each classmate during the time intervals from 2005‑2009 and 2010‑2014.
For the individual with the largest dollar value increase in median income over the two time intervals, determine the amount of increase.
Need a deep-dive on the concept behind this application? Look no further. Learn more about this topic, algebra and related others by exploring similar questions and additional content below.


 Algebra: Structure And Method, Book 1AlgebraISBN:9780395977224Author:Richard G. Brown, Mary P. Dolciani, Robert H. Sorgenfrey, William L. ColePublisher:McDougal Littell