Videos
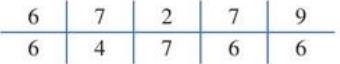
(A) Construct a frequency table and histogram for the following data set using a class interval
width of
(B) Construct a frequency table and histogram for the following data set using a class interval
width of
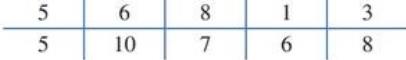
(c) How are the two histograms of parts (A) and (B) similar? How are the two data sets different?
Want to see the full answer?
Check out a sample textbook solution
Chapter 11 Solutions
Student's Solutions Manual For Finite Mathematics For Business, Economics, Life Sciences And Social Sciences
Additional Math Textbook Solutions
Mathematics with Applications In the Management, Natural, and Social Sciences (12th Edition)
Calculus Volume 1
Thinking Mathematically (6th Edition)
Probability and Statistics for Engineers and Scientists
Using and Understanding Mathematics: A Quantitative Reasoning Approach (6th Edition)
Finite Mathematics & Its Applications (12th Edition)


 Discrete Mathematics and Its Applications ( 8th I...MathISBN:9781259676512Author:Kenneth H RosenPublisher:McGraw-Hill Education
 Mathematics for Elementary Teachers with Activiti...MathISBN:9780134392790Author:Beckmann, SybillaPublisher:PEARSON
 Thinking Mathematically (7th Edition)MathISBN:9780134683713Author:Robert F. BlitzerPublisher:PEARSON
 Discrete Mathematics With ApplicationsMathISBN:9781337694193Author:EPP, Susanna S.Publisher:Cengage Learning,
 Pathways To Math Literacy (looseleaf)MathISBN:9781259985607Author:David Sobecki Professor, Brian A. MercerPublisher:McGraw-Hill Education