
Applied Statistics in Business and Economics
5th Edition
ISBN: 9780077837303
Author: David Doane, Lori Seward Senior Instructor of Operations Management
Publisher: McGraw-Hill Education
expand_more
expand_more
format_list_bulleted
Videos
Textbook Question
Chapter 11.2, Problem 1SE
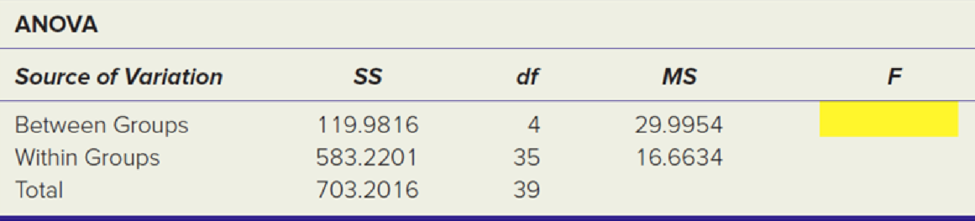
Using the following Excel results: (a) What was the overall
Expert Solution & Answer
Want to see the full answer?
Check out a sample textbook solution
Students have asked these similar questions
All other conditions being equal, does a larger sample size increase or decrease the corresponding magnitude of the z or t value of the sample test statistic?
In a test of H0: p = 0.4 against H1: p ≠ 0.4, a sample of size 100 produces Z = 1.28 for the value of the test statistic. Thus the p-value (or observed level of significance) of the test is approximately equal to:
Under what circumstances can you use a z-test instead of a t-test to compare a sample against a population?
Chapter 11 Solutions
Applied Statistics in Business and Economics
Ch. 11.2 - Using the following Excel results: (a) What was...Ch. 11.2 - Using the following Excel results: (a) What was...Ch. 11.2 - In a one-factor ANOVA with sample sizes n1 = 5, n2...Ch. 11.2 - In a one-factor ANOVA with sample sizes n1 = 8, n2...Ch. 11.2 - Instructions for Exercises 11.5 through 11.8: For...Ch. 11.2 - Instructions for Exercises 11.5 through 11.8: For...Ch. 11.2 - Instructions for Exercises 11.5 through 11.8: For...Ch. 11.2 - Prob. 8SECh. 11.3 - Consider a one-factor ANOVA with n1 = 9, n2 = 10,...Ch. 11.3 - Consider a one-factor ANOVA with n1 = 6, n2 = 5,...
Ch. 11.3 - Instructions for Exercises 11.11 through 11.14:...Ch. 11.3 - Prob. 12SECh. 11.3 - Prob. 13SECh. 11.3 - Prob. 14SECh. 11.4 - In a one-factor ANOVA with n1 = 6, n2 = 4, and n3...Ch. 11.4 - Prob. 16SECh. 11.4 - Instructions for Exercises 11.17 through 11.20:...Ch. 11.4 - Instructions for Exercises 11.17 through 11.20:...Ch. 11.4 - Instructions for Exercises 11.17 through 11.20:...Ch. 11.4 - Instructions for Exercises 11.17 through 11.20:...Ch. 11.5 - Instructions: For each data set: (a) State the...Ch. 11.5 - Instructions: For each data set: (a) State the...Ch. 11.5 - Instructions: For each data set: (a) State the...Ch. 11.5 - Instructions: For each data set: (a) State the...Ch. 11.6 - Instructions: For each data set: (a) State the...Ch. 11.6 - Instructions: For each data set: (a) State the...Ch. 11.6 - Prob. 27SECh. 11.6 - Prob. 28SECh. 11 - Explain each term: (a) explained variation; (b)...Ch. 11 - (a) Explain the difference between one-factor and...Ch. 11 - (a) State three assumptions of ANOVA. (b) What do...Ch. 11 - (a) Sketch the format of a one-factor ANOVA data...Ch. 11 - (a) Sketch the format of a two-factor ANOVA data...Ch. 11 - (a) Sketch the format of a two-factor ANOVA data...Ch. 11 - Prob. 7CRCh. 11 - (a) What does a test for homogeneity of variances...Ch. 11 - What is the general linear model and why is it...Ch. 11 - (a) What is a 2k design, and what are its...Ch. 11 - Instructions: You may use Excel, MegaStat,...Ch. 11 - Instructions: You may use Excel, MegaStat,...Ch. 11 - Instructions: You may use Excel, MegaStat,...Ch. 11 - Instructions: You may use Excel, MegaStat,...Ch. 11 - Instructions: You may use Excel, MegaStat,...Ch. 11 - Instructions: You may use Excel, MegaStat,...Ch. 11 - Instructions: You may use Excel, MegaStat,...Ch. 11 - Instructions: You may use Excel, MegaStat,...Ch. 11 - Instructions: You may use Excel, MegaStat,...Ch. 11 - Instructions: You may use Excel, MegaStat,...Ch. 11 - Instructions: You may use Excel, MegaStat,...Ch. 11 - Instructions: You may use Excel, MegaStat,...Ch. 11 - Instructions: You may use Excel, MegaStat,...Ch. 11 - Instructions: You may use Excel, MegaStat,...Ch. 11 - Instructions: You may use Excel, MegaStat,...Ch. 11 - Instructions: You may use Excel, MegaStat,...Ch. 11 - Instructions: You may use Excel, MegaStat,...Ch. 11 - In a market research study, members of a consumer...Ch. 11 - Prob. 47CECh. 11 - (a) What kind of ANOVA is this (one-factor,...Ch. 11 - Here is an Excel ANOVA table for an experiment to...Ch. 11 - Several friends go bowling several times per...Ch. 11 - Air pollution (micrograms of particulate per ml of...Ch. 11 - A company has several suppliers of office...Ch. 11 - Several friends go bowling several times per...Ch. 11 - Are large companies more profitable per dollar of...
Additional Math Textbook Solutions
Find more solutions based on key concepts
Testing Hypotheses. In Exercises 13-24, assume that a simple random sample has been selected and test the given...
Elementary Statistics Using the TI-83/84 Plus Calculator, Books a la Carte Edition (4th Edition)
TRY IT YOURSELF 2
Determine whether each number describes a population parameter or a sample statistic. Explain...
Elementary Statistics: Picturing the World (7th Edition)
Ten equally qualified marketing assistants are candidates for promotion to associate buyer; seven are men and t...
An Introduction to Mathematical Statistics and Its Applications (6th Edition)
A father rates his daughter as a 2 on a 7-point scale (from 1 to 7) of crankiness. In this example, (a) what is...
Statistics for Psychology
In Hamilton County, Ohio, the mean number of days needed to sell a house is 86 days (Cincinnati Multiple Listin...
STATISTICS F/BUSINESS+ECONOMICS-TEXT
In Exercises 9-20, use the data in the following table, which lists drive-thru order accuracy at popular fast f...
Elementary Statistics (13th Edition)
Knowledge Booster


Learn more about
Need a deep-dive on the concept behind this application? Look no further. Learn more about this topic, statistics and related others by exploring similar questions and additional content below.Similar questions
- You are testing the null hypothesis that there is no linear relationship between two variables, X and Y. From your sample of n=18,you determine that b1=4.6 and Sb1=1.9. c. Based on your answers to (a) and (b), what statistical decision should you make? d. Construct a 95% confidence interval estimate of the population slope, β1.arrow_forwardYou are testing the null hypothesis that there is no linear relationship between two variables, X and Y. From your sample of n=18, you determine that b1=5.2 and Sb1=1.2. a. What is the value of tSTAT? b. At the α=0.05 level of significance, what are the critical values? c. Based on your answers to (a) and (b), what statistical decision should you make? d. Construct a 95% confidence interval estimate of the population slope, β1.arrow_forwardFor the following cases, you may use either the P-value approach or the rejection region approach to present a full hypothesis test, including: Identifying the claim and H0 and Ha, Finding the appropriate standardized test statistic, Finding the P-value or the rejection region, Deciding whether to reject or fail to reject the null hypothesis, and Interpreting the decision in the context of the original claim. A scientist claims that pneumonia causes weight loss in mice. The table below shows weight, in grams, of six mice before infection with pneumonia and two days after infection. At α = 0.01, evaluate the scientist’s claim. Before After Mouse 1 19.8 18.4 Mouse 2 20.2 19.6 Mouse 3 19.9 19.1 Mouse 4 22.1 20.7 Mouse 5 23.4 22.2 Mouse 6 23.6 23.0arrow_forward
- In a test of H0: µ = 50 against Ha: µ > 50, the sample data yielded the teststatistic z = 2.24. Find and interpret the p-value for the test.(using Table II)arrow_forwardYou want to conduct a test to determine whether there are significant differences in the mean impurity levels for polymers produced with three different catalysts. Which statistical test is appropriate for this scenario? Select one: a. paired t test b. one-sample t test c. one-way ANOVA d. two-sample t testarrow_forwardI have asked this question twice and both times it has been wrong The corrosive effects of various soils on coated and uncoated steel pipe was tested by using a dependent sampling plan. The data collected are summarized below, where d is the amount of corrosion on the coated portion subtracted from the amount of corrosion on the uncoated portion. Does this random sample provide sufficient reason to conclude that the coating is beneficial? Use ? = 0.01 and assume normality. n = 44, Σd = 224, Σd2 = 6268(a) Find t. (Give your answer correct to two decimal places.)arrow_forward
- Also, using α = .05, run a two-tail t-test for one sample to test Ho: µ=283 for the 2009 scores. Report the t-obt, df, and p-values. Would you reject the null hypothesis that the 2009 scores come from a population with average 283? If this is the case, does it come from a population from larger or smaller average?arrow_forwardFor the following cases, you may use either the P-value approach or the rejection region approach to present a full hypothesis test, including: Identifying the claim and H0 and Ha, Finding the appropriate standardized test statistic, Finding the P-value or the rejection region, Deciding whether to reject or fail to reject the null hypothesis, and Interpreting the decision in the context of the original claim. A fitness magazine advertises that the mean monthly cost of joining a health club is less than $25. You work for a consumer advocacy group and are asked to test this claim. You find that a random sample of 18 clubs has a mean monthly cost of $26.25 and a standard deviation of $3.23. Perform the appropriate hypothesis test at α = 0.10.arrow_forwardFor the following statement, choose the most appropriate research design, and the appropriate levels of the IV, from the options below. People with brain damage in the frontal lobes are less able to control their impulses than healthy people without brain damage. Most appropriate design: Quasi-experiment; Levels of I.V.: Brain damage; No Brain damage Most appropriate design: Repeated measures; Levels of I.V.: Brain damage; No Brain damage Most appropriate design: Quasi-experiment; Levels of I.V.: Inhibition; No inhibition Most appropriate design: Randomised-experiment; Levels of I.V.: Brain damage; No Brain damage For the following statement, choose the most appropriate research design, and the appropriate levels of the IV, from the options below. Spacing your study over several days leads to bettter learning than if you study for the same amount time in a single "cram" session. Most appropriate design: Randomised Experiment; Levels of I.V.: Spaced study over several days; Cram…arrow_forward
- For a certain experiment, the following values of fracture stress (in megapascals) presented below were measured for a sample of 24 mixtures of hot-mixed asphalt (HMA). Determine the median, the lower quartile, the upper quartile, and the 65th percentile of the measurements.arrow_forwardIn testing Ho: p ≤ 0.30 against p ˃ 0.30, the critical value of the test statistic is z = +1.96. If the sample proportion is p^ = 0.35 and the standard error of the sample proportion is 0.02, what would the appropriate conclusion be?arrow_forward
arrow_back_ios
arrow_forward_ios
Recommended textbooks for you
 MATLAB: An Introduction with ApplicationsStatisticsISBN:9781119256830Author:Amos GilatPublisher:John Wiley & Sons Inc
 Probability and Statistics for Engineering and th...StatisticsISBN:9781305251809Author:Jay L. DevorePublisher:Cengage Learning
 Statistics for The Behavioral Sciences (MindTap C...StatisticsISBN:9781305504912Author:Frederick J Gravetter, Larry B. WallnauPublisher:Cengage Learning
 Elementary Statistics: Picturing the World (7th E...StatisticsISBN:9780134683416Author:Ron Larson, Betsy FarberPublisher:PEARSON
 The Basic Practice of StatisticsStatisticsISBN:9781319042578Author:David S. Moore, William I. Notz, Michael A. FlignerPublisher:W. H. Freeman
 Introduction to the Practice of StatisticsStatisticsISBN:9781319013387Author:David S. Moore, George P. McCabe, Bruce A. CraigPublisher:W. H. Freeman
MATLAB: An Introduction with Applications
Statistics
ISBN:9781119256830
Author:Amos Gilat
Publisher:John Wiley & Sons Inc
Probability and Statistics for Engineering and th...
Statistics
ISBN:9781305251809
Author:Jay L. Devore
Publisher:Cengage Learning
Statistics for The Behavioral Sciences (MindTap C...
Statistics
ISBN:9781305504912
Author:Frederick J Gravetter, Larry B. Wallnau
Publisher:Cengage Learning
Elementary Statistics: Picturing the World (7th E...
Statistics
ISBN:9780134683416
Author:Ron Larson, Betsy Farber
Publisher:PEARSON
The Basic Practice of Statistics
Statistics
ISBN:9781319042578
Author:David S. Moore, William I. Notz, Michael A. Fligner
Publisher:W. H. Freeman
Introduction to the Practice of Statistics
Statistics
ISBN:9781319013387
Author:David S. Moore, George P. McCabe, Bruce A. Craig
Publisher:W. H. Freeman
Hypothesis Testing using Confidence Interval Approach; Author: BUM2413 Applied Statistics UMP;https://www.youtube.com/watch?v=Hq1l3e9pLyY;License: Standard YouTube License, CC-BY
Hypothesis Testing - Difference of Two Means - Student's -Distribution & Normal Distribution; Author: The Organic Chemistry Tutor;https://www.youtube.com/watch?v=UcZwyzwWU7o;License: Standard Youtube License