
Concept explainers
Videos
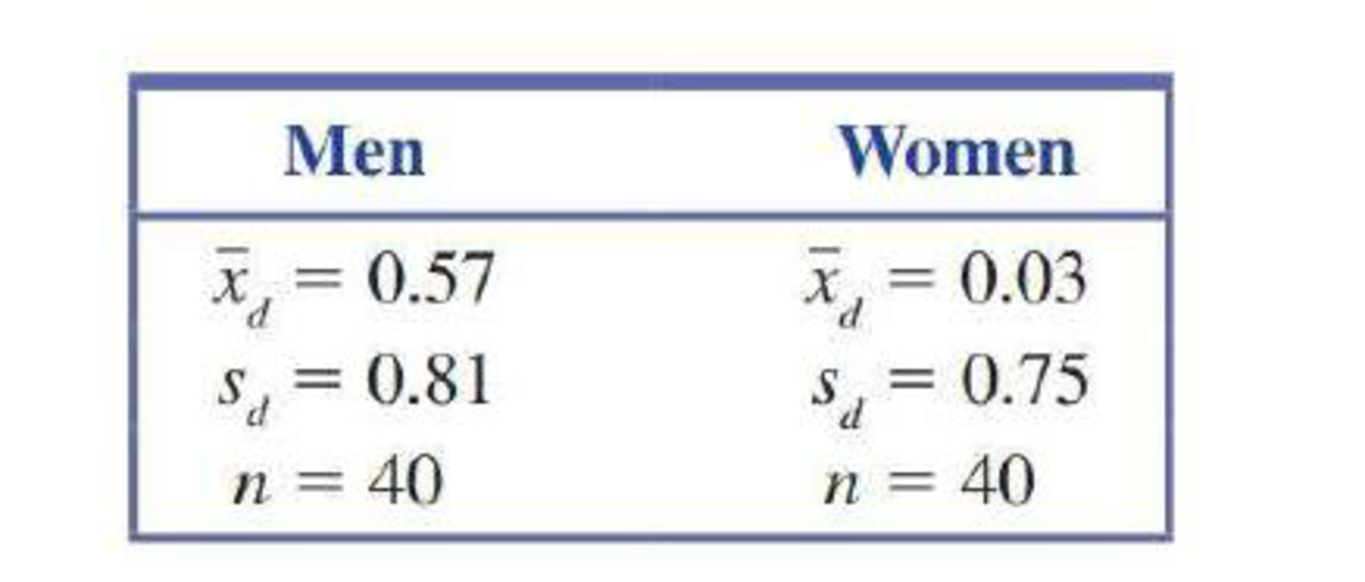
The paper “The Truth About Lying in Online Dating Profiles” (Proceedings, Computer-Human Interaction [2007]: 1–4) describes an investigation in which 40 men and 40 women with online dating profiles agreed to participate in a study. Each participant’s height (in inches) was measured and the actual height was compared to the height given in that person’s online profile. The differences between the online profile height and the actual height (profile – actual) were used to calculate the values in the accompanying table.
You can assume it is reasonable to regard the two samples in this study as being representative of male online daters and female online daters. (Although the authors of the paper believed that their samples were representative of these populations, participants were volunteers recruited through newspaper advertisements, so we should be a bit hesitant to generalize results to all online daters.)
- a. Use the paired t test to determine if there is convincing evidence that, on average, male online daters overstate their height in online dating profiles. Use α = 0.05.
- b. Construct and interpret a 95% confidence interval for the difference between the
mean online dating profile height and mean actual height for female online daters. (Hint: See Example 11.8.) - c. Use the two-sample t test of Section 11.1 to test H0: μm – μf = 0 versus Ha: μm – μf > 0, where μm is the mean height difference (profile – actual) for male online daters and μf, is the mean height difference (profile – actual) for female online daters.
- d. Explain why a paired t test was used in Part (a) but a two-sample t test was used in Part (c).
a.
Check whether there is convincing evidence that the average male online daters overstate their height in online dating profile or not.
Answer to Problem 29E
There is convincing evidence that the average male online daters overstate their height in online dating profile.
Explanation of Solution
Calculation:
Total of 40 men and 40 women are sampled. The sample size, standard deviation, and mean for diference between profile height and actual height, for men and women are given.
Assumption for conducting the test:
- The sample difference should be a random sample.
- The population distribution for the mean differences should follow approximately normal distribution.
- The samples are paired.
Here, the samples are paired. It is reasonable to assume that the two samples of men and women acts as the representative for all the male online daters and female online daters.
Let
Let
Here,
That is,
Hypotheses:
Null hypothesis:
That is, the mean difference between profile height and actual height, for men is zero.
Alternative hypothesis:
That is, the mean difference between profile height and actual height is greater than zero.
Test statistic:
Software procedure:
Step by step procedure to obtain the test statistic by using MINITAB software is given below:
- Choose Stat > Basic Statistics > Paired t.
- Choose summarized data.
- In choose sample size as 40, means as 0.57 and standard deviation as 0.81.
- Choose Options.
- In Confidence level, enter 95.
- In Alternative, select greater than.
- Click OK in all dialogue boxes.
Output using the MINITAB software is given below:
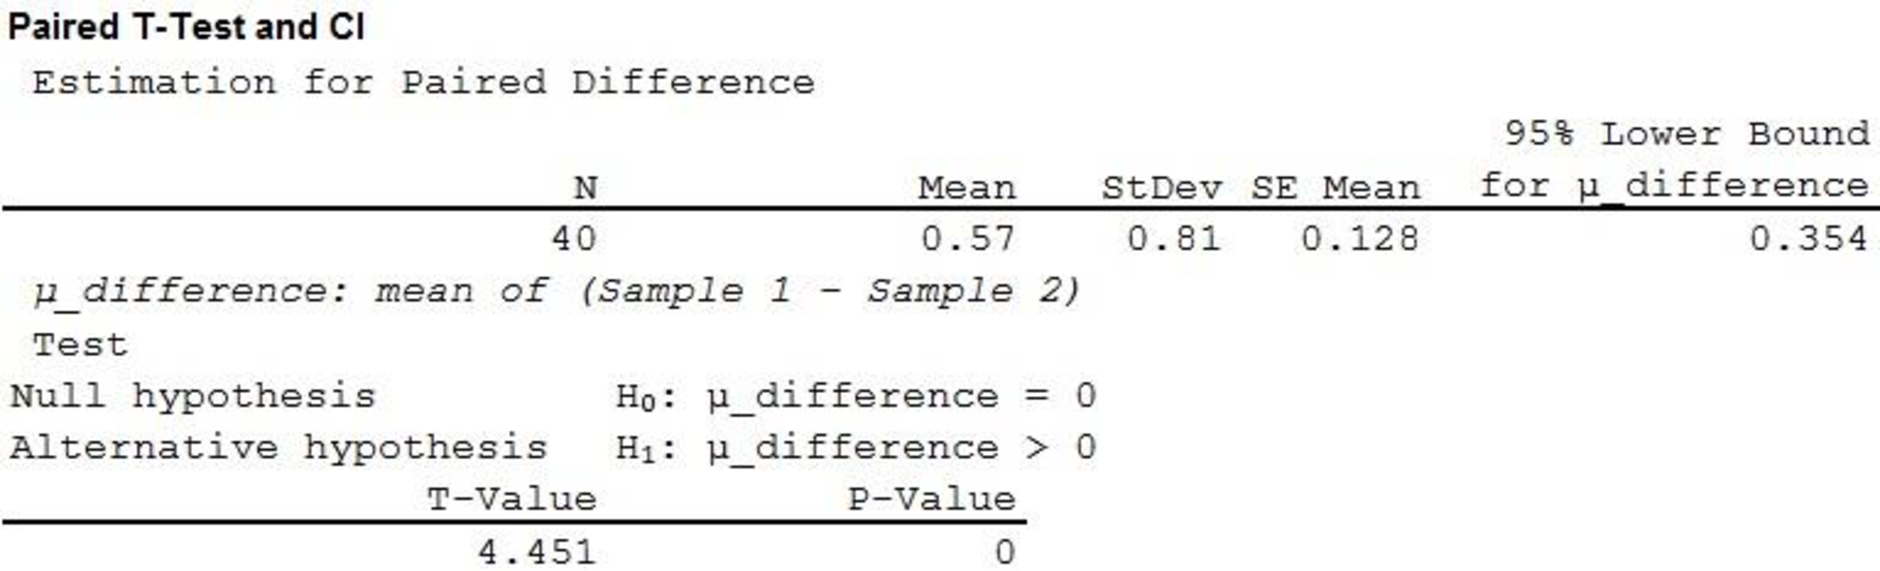
From the above MINITAB output the test statistic is 4.451 and the P-value is 0.
Decision rule:
- If P-value is less than or equal to the level of significance, reject the null hypothesis.
- Otherwise fail to reject the null hypothesis.
Conclusion:
Here, the level of significance is 0.05.
Here, P-value is less than the level of significance.
That is,
Therefore, reject the null hypothesis.
It can be concluded that there is convincing evidence that the average male online daters overstate their height in online dating profile.
b.
Construct a 95% confidence interval for the difference in mean profile height and mean actual height for female online daters.
Interpret the interval.
Answer to Problem 29E
The 95% confidence interval for the difference in mean profile height and mean actual height for female online daters is
Explanation of Solution
Calculation:
Assumptions for conducting the hypothesis test:
- The sample difference should be a random sample.
- The population distribution for the mean differences should follow approximately normal distribution.
- The samples are paired.
Here, samples are paired. The selected samples were representatives of population. Since the sample size is large
Confidence interval:
Software procedure:
Step by step procedure to obtain the confidence interval by using MINITAB software is as follows:
- Choose Stat > Basic Statistics > Paired t.
- Choose summarized data.
- In choose sample size as 40, means as 0.03 and standard deviation as 0.75.
- Choose Options.
- In Confidence level, enter 95.
- In Alternative, select not equal.
- Click OK in all dialogue boxes.
Output using the MINITAB software is given below:
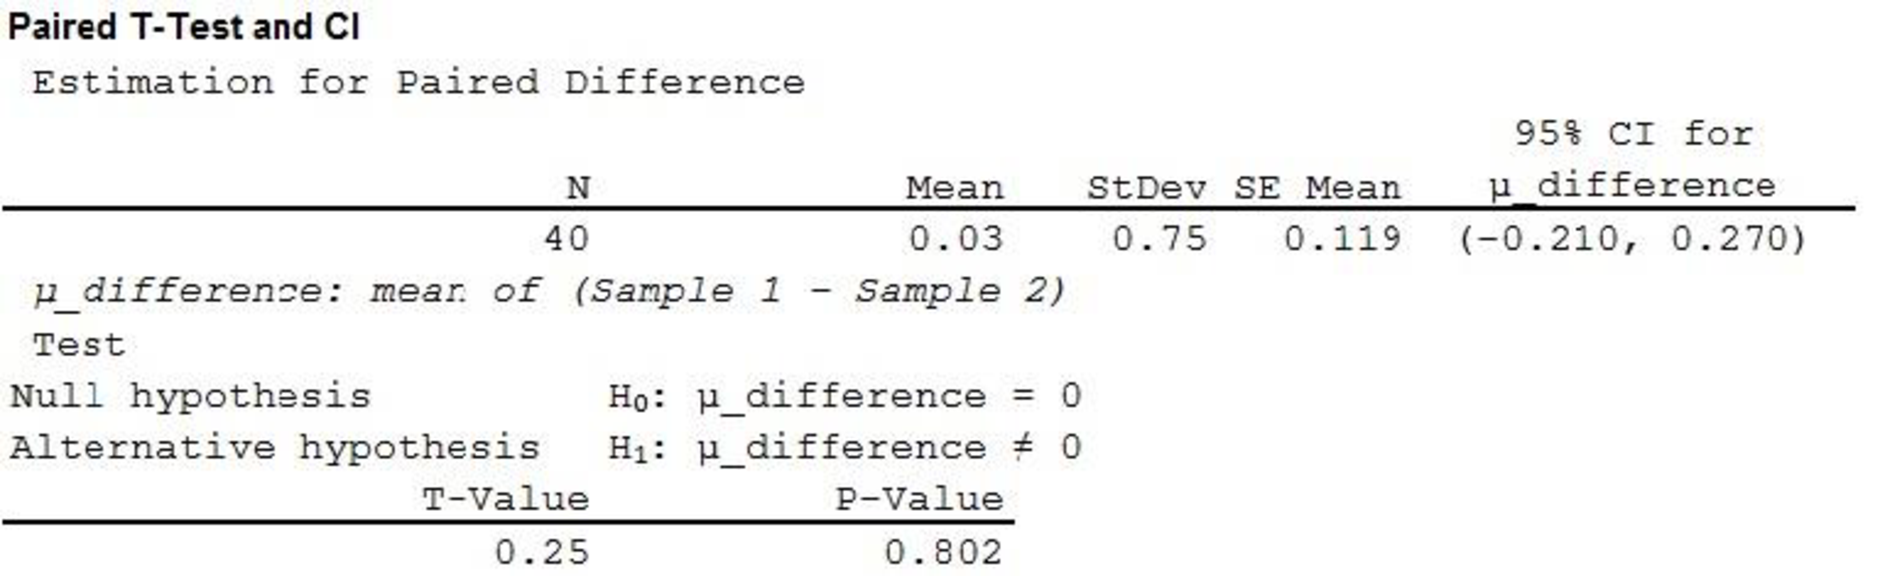
From the output, the 95% confidence interval is
Interpretation:
One can be 95% confident that the difference in mean profile height and mean actual height for female online daters lies between –0.210 and 0.270.
c.
Conduct a two sample t-test.
Answer to Problem 29E
There is convincing evidence that the mean height difference is higher for males than females.
Explanation of Solution
Calculation:
In this context, two sample t-test is used for the comparison.
Assumption for the two sample t-test:
- The random samples should be collected independently.
- The sample sizes should be large. That is, each sample size is at least 30. Or the populations are approximately normally distributed.
Requirement check:
Here, samples are selected at random from the population. Each sample has size of 40, which is greater than 30.
Therefore, the assumptions are satisfied.
Let
Let
Hypotheses:
Null hypothesis:
That is, the mean height difference is same for both males and females.
Alternative hypothesis:
That is, the mean height difference is higher for males than females.
Test statistic and P-value:
Software procedure:
Step by step procedure to obtain the P-value and test statistic by using MINITAB software:
- Choose Stat > Basic Statistics > 2 sample t.
- Choose Summarized data.
- In sample 1, enter Sample size as 40, Mean as 0.57, Standard deviation as 0.03.
- In sample 2, enter Sample size as 40, Mean as 0.03, Standard deviation as 0.75.
- Choose Options.
- In Confidence level, enter 95.
- In Alternative, select greater than.
- Click OK in all the dialogue boxes.
Output using the MINITAB software is given below:
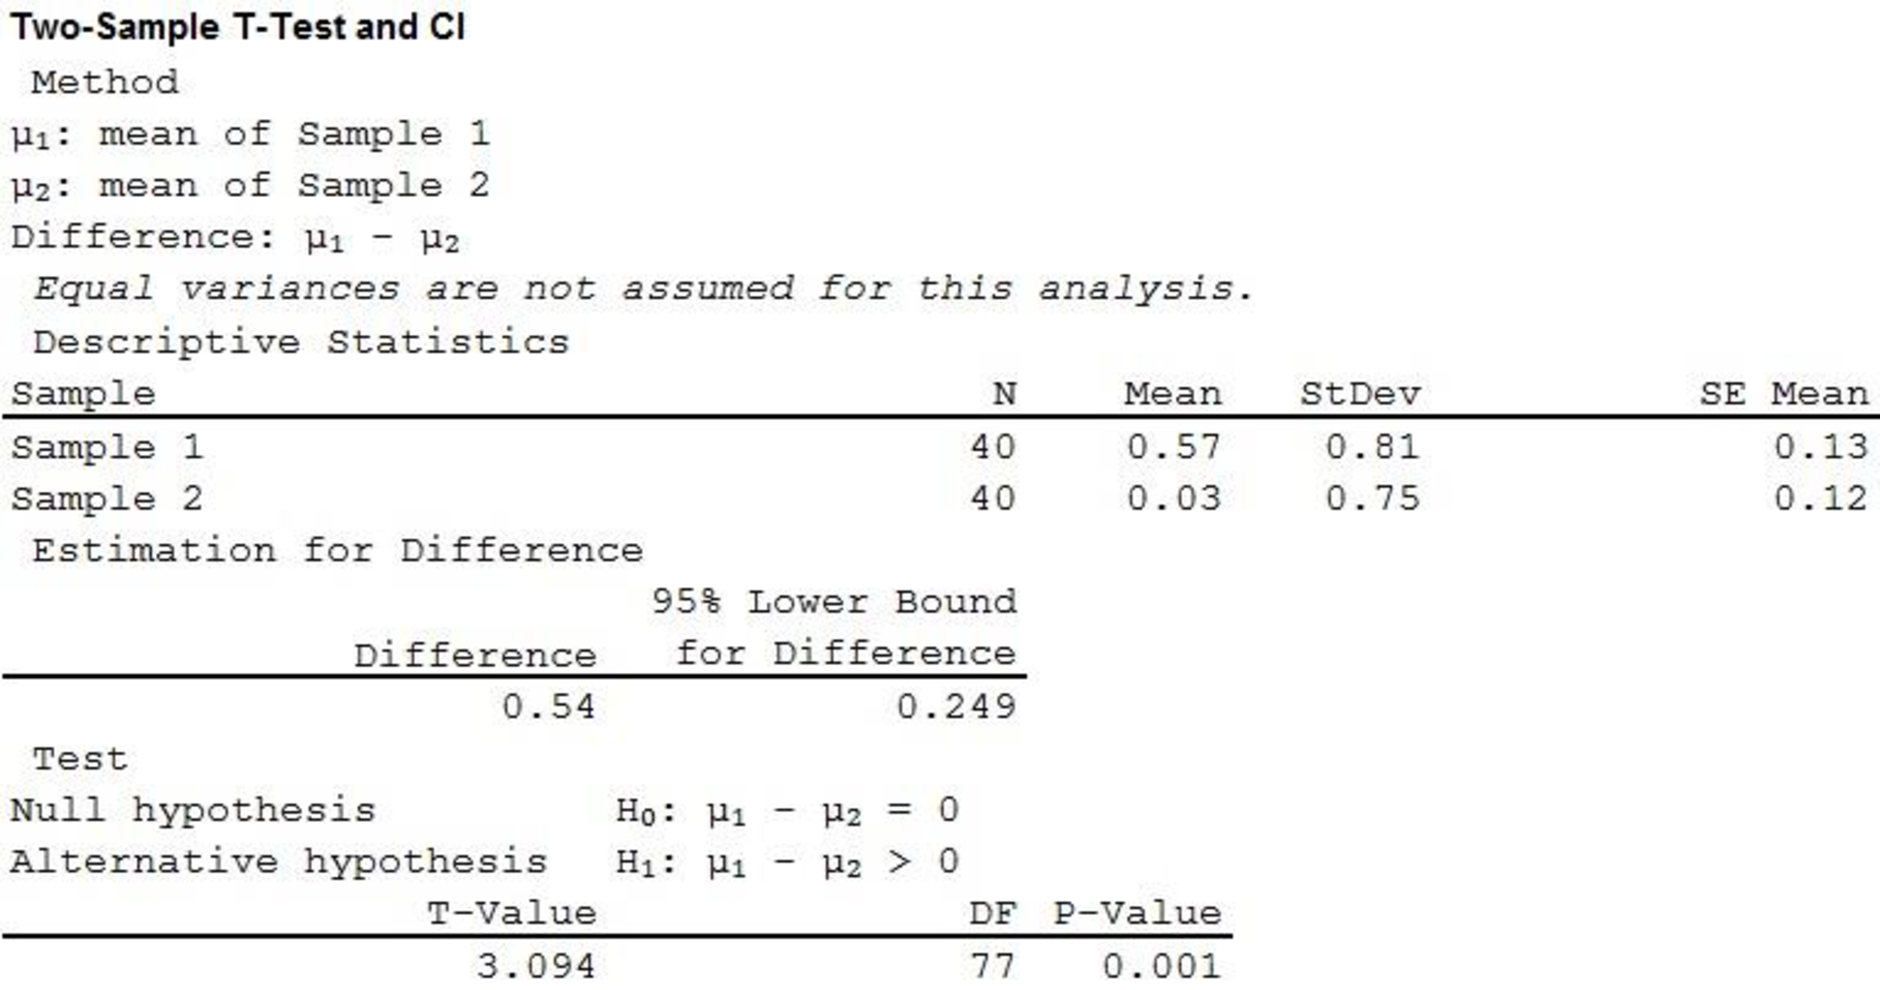
Therefore, the P-value is 0.001 and the test statistic is 3.094.
Decision rule:
- If P-value is less than or equal to the level of significance, reject the null hypothesis.
- Otherwise fail to reject the null hypothesis.
Conclusion:
Here, the level of significance is 0.05.
Here, P-value is less than the level of significance.
That is,
Therefore, reject the null hypothesis.
Hence, it can be concluded that there is convincing evidence that the mean height difference is higher for males than females.
d.
Explain the reason for paired t test was used in Part (a) two sample t-test was used in Part (c).
Explanation of Solution
Calculation:
In this context, the result obtained in Part (a) compares the mean actual and profile height for males. That is, the male profile and actual heights are paired. Therefore, the paired t test was used in Part (a).
Now, in this case, the result obtained in Part (c) compares the mean height difference for male and female. That is, the samples of male and female are independent. Therefore, the two sample t-test was used in Part (c).
Want to see more full solutions like this?
Chapter 11 Solutions
Introduction to Statistics and Data Analysis


- A diabetic nurse seeks to assess the prevalence of type 2 diabetes among women in a population (age 18 to 80 years). She conveniently sampled 100 women attending antenatal care and asked them whether they had hypertension. Of the 100 pregnant women sampled, 50 consented to take part in the study and 1 had diabetes. Based on this finding, the nurse concluded that “the prevalence of diabetes among women in the population is low (2%).” A) Do you agree with the conclusion made by the diabetic nurse? Justify in not more than 100 words? B) Would you have conducted such a study differently if you had all the resources at hand (Describe in not more than 75 words).arrow_forwardWhen companies are designing a new product, one of the steps typically taken is to see how potential buyers react to a picture or prototype of the proposed product. The product-development team for a notebook computer company has shown picture A to a large sample of potential buyers and picture B to another, asking each person to indicate what they "would expect to pay" for such a product. The data resulting from the two pictures are provided in file (sheet 6). Using the 0.05 level of significance, determine whether the prototypes might not really differ in terms of the price that potential buyers would expect to pay. Sheet 6 ComputerA ComputerB 3 317 2 965 2 680 3 083 3 286 3 137 2 859 2 950 2 693 3 161 2 945 2 918 2 908 3 158 3 193 3 082 3 240 2 903 3 040 3 103…arrow_forwardMedical research has shown that repeated wrist extensions beyond 20 degrees increase the risk of wrist and hand injuries. Each of 24 students at Cornell University used a proposed new computer mouse design, and while using the mouse, each student’s wrist extension was recorded. Data consistent with summary values given in the paper “Comparative Study of Two Computer Mouse Designs” (Cornell Human Factors Laboratory Technical Report RP7992) are given here. 27 28 24 26 27 25 25 24 24 22 25 24 28 27 26 31 25 28 25 28 27 25 a. Use these data to estimate the mean wrist extension for people using this new mouse design using a 90% confidence interval.b. What assumptions are required in order for it to be appropriate to generalize your estimate to the population of Cornell students? To the population of all university students?c. Based on your interval from Part (a), do you think there is reason to believe that the mean wrist extension for people using the new mousedesign is…arrow_forward
- In a study examining the effect of humor on interpersonal attractions, McGee and Shevlin (2009) foundthat a man’s sense of humor had a significant effect onhow he was perceived by women. In the study, femalecollege students were given brief descriptions of a potential romantic partner and then rated the attractivenessof the male on a scale from 1 (low) to 7 (high). Thefictitious male was described positively as being single,ambitious, and having good job prospects. In one condition, the description also said that he had a great senseof humor. The results showed that the description wasrated significantly higher when “a sense of humor” wasincluded. To further examine this effect, a researcherselected a sample of n = 16 college males and askedthem to read a brief description of a female and thenrate the attractiveness of the woman in the description.The description had been used in previous research butwas modified by adding a statement describing a goodsense of humor. Based on the…arrow_forwardIn a study of three nationally representative large- scale data sets from Ireland, the United States, and the United Kingdom (n = 17,247), teenagers between the ages of 12 to 15 were asked to keep a diary of their screen time and answer questions about how they felt or acted. Identify the explanatory variables. Comment on wheter the results of the study can be generalized to the population and whyarrow_forward
 Glencoe Algebra 1, Student Edition, 9780079039897...AlgebraISBN:9780079039897Author:CarterPublisher:McGraw Hill