
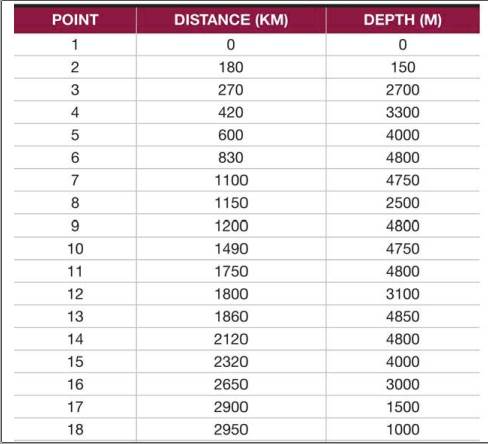
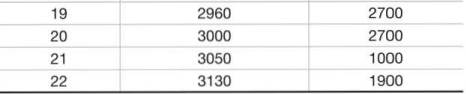
The data in Table 11.1 were gathered by a ship equipped with an echo sounder as it traveled the North Atlantic Ocean eastward from Cape Cod, Massachusetts, to a point somewhat beyond the center of the Atlantic Ocean. Use the data in Table 11.1 to construct a generalized profile of the ocean floor in the North Atlantic on Figure 11.4. Begin by plotting the distance of each point from Cape Cod, at the indicated depth. Complete the profile by connecting the points.

Learn your wayIncludes step-by-step video

Chapter 11 Solutions
APPLICATIONS+INVESTIGATIONS IN EARTH
Additional Business Textbook Solutions
Exercises for Weather & Climate (9th Edition)
Applications and Investigations in Earth Science (8th Edition)
Concepts of Genetics (12th Edition)
Human Anatomy & Physiology (Marieb, Human Anatomy & Physiology) Standalone Book
Lecture- Tutorials for Introductory Astronomy
Essential University Physics: Volume 2 (3rd Edition)

- Answer the following questions based on what you learned about the information cycle. (a) What type of information sources might you find if you were researching the events of September 11, 2001? (b) What type of information sources might you find if you were researching the 7.6 magnitude earthquake that hit Noto peninsula, Japan on January 1, 2024? (c) Are the information sources you might found for (a) and (b) the same or differ? Briefly explain why the sources is the same or differ.arrow_forwardor students doing a Project Study and students doing an internship, prepare a journal entry sharing your reflections on your experience in collecting the (primary) data you collected for your research. For students doing a Systematic Review prepare a journal entry sharing your reflections on your experience in collecting the (secondary) data you collected from your selected resources. You are to follow Gibb’s Reflective Cycle as your guide in laying out your reflection.arrow_forwardI need help with the last two subsets (d and e). I have created a chart for the EBIT-EPS coordinates.arrow_forward
- Suppose you're given a data set that classifies each sample unit into one of four categories: A, B, C, the data as A = 1, B=2, C = 3, and D=4. Are the data consisting of the classifications A, B, C, and D or quantitative? Are the data consisting of the classifications A, B, C, and D qualitiative or quantitative? OA. Qualitative, because they are measured on a naturally occuring numerical scale. B. Quantitative, because they are measured on a naturally occuring numerical scale. C. Quantitative, because they can only be classified into categories. D. Qualitative, because they can only be classified into categories. *** After the data are input as 1, 2, 3, or 4, are they qualitative or quantitative? OA. Qualitative, because they cannot be meaningfully added, subtracted, multiplied, or divided. B. Qualitative, because they are measured on a naturally occurring numerical scale. OC. Quantitative, because they are measured on a naturally occurring numerical scale. OD. Quantitative, because…arrow_forwardThe following 20 observations are for two quantitative variables, x and y. a. Create a scatter chart for these 20 observations. b. Fit a linear trendline to the 20 observations. What can you say about the relationship between the two quantitative variables?arrow_forwardA highway department is studying the relationship between traffic flow and speed during rush hour on Highway 193. The data in the file TrafficFlow were collected on Highway 193 during 100 recent rush hours. a. Develop a scatter chart for these data. What does the scatter chart indicate about the relationship between vehicle speed and traffic flow? b. Develop an estimated simple linear regression equation for the data. How much variation in the sample values of traffic flow is explained by this regression model? Use a 0.05 level of significance to test the relationship between vehicle speed and traffic flow. What is the interpretation of this relationship? c. Develop an estimated quadratic regression equation for the data. How much variation in the sample values of traffic flow is explained by this regression model? Test the relationship between each of the independent variables and the dependent variable at a 0.05 level of significance. How would you interpret this model? Is this model superior to the model you developed in part (b)? d. As an alternative to fitting a second-order model, fit a model using a piecewise linear regression with a single knot. What value of vehicle speed appears to be a good point for the placement of the knot? Does the estimated piecewise linear regression provide a better fit than the estimated quadratic regression developed in part (c)? Explain. e. Separate the data into two sets such that one data set contains the observations of vehicle speed less than the value of the knot from part (d) and the other data set contains the observations of vehicle speed greater than or equal to the value of the knot from part (d). Then fit a simple linear regression equation to each data set. How does this pair of regression equations compare to the single piecewise linear regression with the single knot from part (d)? In particular, compare predicted values of traffic flow for values of the speed slightly above and slightly below the knot value from part (d). f. What other independent variables could you include in your regression model to explain more variation in traffic flow?arrow_forward
- GIVEN THE FOLLOWING DATA, COMPUTE FOR THE FOLLOWING: 1. STRAIGHT LINE METHOD 2. ARITHMETIC GEOMETRIC CURVE 3. STATISTICAL PARABOLIC CURVE WRITE A RECOMMENDATION REGARDING THE RESULTS AND WHICH OF THE NETHOD IS BEST FIT FOR THE DATA. Nate: answer on a separate document. Use excel in compute. 2. Supposed this is Yc (straightline) 450,000 370,000 750,000 1,100,000 1,500,000 1,000,000 1,700,000 2,000,000 1,900,000 2,300,000 Yi + 1 (Geometric) YEAR SALES 415,000 1 356,000 703,556 1,023,400 1,308,905 900,573 1,504,789 1,705,932 1,895,890 2,094,256 450,000 370,000 750,000 1,100,000 1,500,000 1,000,000 1,700,000 2,000,000 1,900,000 2,300,000 2011 2012 2013 3 2014 4. 2015 2016 6. 2017 2018 8 2019 2020 10arrow_forwardHello Bartleby team, I've gone ahead and attached a screenshot of my question. Please note: The screenshot image with the Quantitative Problem is the question needing to be answered. The other screenshot is for reference if you need any of the information from that page. Let me know if you need any further details. Thank you for any answers and/or explanations you may provide!arrow_forwardPage 2 of 2 Assignment 2: (CLO 5): MS Excel application: Determine any four related variables, two of them are qualitative (Categorical) and two are quantitative (Numerical). a. Input sufficient data about the four variables (a random sample of 50 or more) in MS-Excel sheet. b. Prepare frequency distribution tables for one qualitative and one quantitative variable. c. Prepare appropriate graphs for each of the two tables. d. Prepare a pivot table (cross tabulation) consists of two qualitative variables (in rows and columns) and one quantitative variable as values. e. Conduct descriptive analysis for the two quantitative variables (summary measures). f. Find the coefficient of variation (CV) and compare the dispersion of the two variables.arrow_forward
- Compute the mean, median, and mode of the data sample. (If every number of the set is a solution, enter EVERY in the answer box.) 3, 4, 4, 8, −4 mean______ median_______ mode__________arrow_forwardRequired information [The following information applies to the questions displayed below.] In any data analytics exercise, it is important to understand the underlying data as an aid in interpreting the results of any analysis undertaken. In this comprehensive problem that covers multiple chapters of the textbook, five cities in the state of New York are the basis for the analysis. The five cities are: . City of Elmira City of Poughkeepsie . City of Rome . City of Saratoga Springs City of Watertown These five cities were selected because they are all in one state, thus governed by the same state reporting and audit requirements. The fact that the cities are governed by one set of reporting requirements means that the data reported follows the same chart of accounts and rules for what should be reported in each account. As you will see, state i requirements may not always follow GAAP requirements or the recommendations of the text. Cities selected are fairly comparable in population…arrow_forwardCollecting data from all members of a given population is called: a. Audit b. Poll c. Sampling d. Censusarrow_forward
 Essentials of Business Analytics (MindTap Course ...StatisticsISBN:9781305627734Author:Jeffrey D. Camm, James J. Cochran, Michael J. Fry, Jeffrey W. Ohlmann, David R. AndersonPublisher:Cengage Learning
 Auditing: A Risk Based-Approach to Conducting a Q...AccountingISBN:9781305080577Author:Karla M Johnstone, Audrey A. Gramling, Larry E. RittenbergPublisher:South-Western College Pub