
EFSC STA 2023 MML ACCESS
6th Edition
ISBN: 9780135927885
Author: Triola
Publisher: PEARSON
expand_more
expand_more
format_list_bulleted
Videos
Textbook Question
Chapter 11.3, Problem 17BB
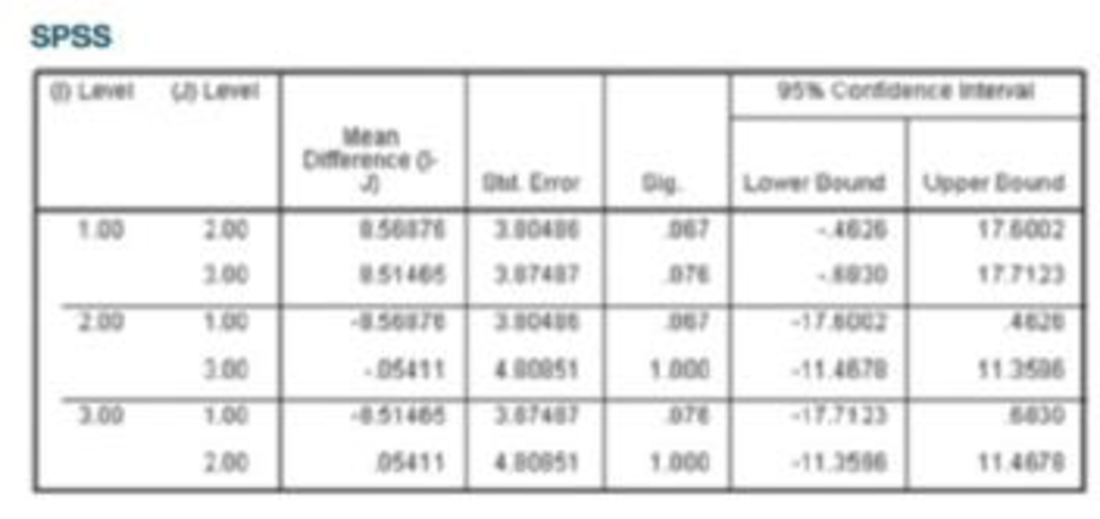
Tukey Test A display of the Bonferroni test results from Table 12-1 (which is part of the Chapter Problem) is provided on page 577. Shown on the top of the next page is the SPSS-generated display of results from the Tukey test using the same data. Compare the Tukey test results to those from the Bonferroni test.
Expert Solution & Answer
Want to see the full answer?
Check out a sample textbook solution
Students have asked these similar questions
A survey was conducted in which both men and women were asked a question about a current issue. Possible responses to this question were “in favor of,” “not in favor of,” or “no opinion.” A chi-square test is to be used to determine whether the response to this question is independent of gender. The number of degrees of freedom for the chi-square test in this situation is
The data is presented in parallel format. Before running the ANOVA in Excel, you will need to put it
into serial (column) format. You will need to create a categorical variable for the first factor (days)
and for the second factor (time of day). This is a critical step.
The data presented shows exam scores for students randomly assigned to the sections meeting on
these days at these times of the day:
Thursday
Friday
Morning
Afternoon
Morning
Afternoon
59.1
60.6
50.2
34.7
50.6
60.5
39
44
57.1
59
71.2
43.7
58.6
45.7
57.5
52.9
51.1
72.6
50
53.3
40.1
39.8
58.1
34.6
27.3
59.3
38.9
53.2
27.3
72.9
58.2
52.9
39.5
45.9
57.9
46.8
56.6
40
71
46.7
Conduct a 2-way ANOVA. First, find the group means for each level of the factors. (Report answers
accurate to 2 decimal places.)
Days:
MThursday
MFriday
Time of day:
Mmorning
Mafternoon
Report the results of the ANOVA for the main & interaction effects. (Report P-values accurate to 4
decimal places and F-ratios accurate to 3 decimal places.)
Day:
FA =
p…
The following questions relate to this SPSS output:
An experimenter wanted to test the effect of music on cognitive performance. She created two equivalent groups and asked each
person to perform a proofreading task on a short research paper. Participants in group 1 performed the task with
no music playing in the background, participants in group 2 performed the task with a selection of hard rock playing in the
Chapter 11 Solutions
EFSC STA 2023 MML ACCESS
Ch. 11.1 - Cybersecurity The table below lists leading digits...Ch. 11.1 - 2. Cybersecurity When using the data from Exercise...Ch. 11.1 - Cybersecurity The accompanying Statdisk results...Ch. 11.1 - Cybersecurity What do the results from the...Ch. 11.1 - In Exercises 520, conduct the hypothesis test and...Ch. 11.1 - In Exercises 520, conduct the hypothesis test and...Ch. 11.1 - In Exercises 520, conduct the hypothesis test and...Ch. 11.1 - In Exercises 520, conduct the hypothesis test and...Ch. 11.1 - In Exercises 520, conduct the hypothesis test and...Ch. 11.1 - In Exercises 520, conduct the hypothesis test and...
Ch. 11.1 - In Exercises 520, conduct the hypothesis test and...Ch. 11.1 - In Exercises 520, conduct the hypothesis test and...Ch. 11.1 - In Exercises 520, conduct the hypothesis test and...Ch. 11.1 - In Exercises 520, conduct the hypothesis test and...Ch. 11.1 - In Exercises 520, conduct the hypothesis test and...Ch. 11.1 - In Exercises 520, conduct the hypothesis test and...Ch. 11.1 - Ben fords Law. According to Benfords law, a...Ch. 11.1 - Ben fords Law. According to Benfords law, a...Ch. 11.1 - Ben fords Law. According to Benfords law, a...Ch. 11.1 - Ben fords Law. According to Benfords law, a...Ch. 11.1 - Assumed mid-point x=fxn=39825180=221.25...Ch. 11.2 - Handedness and Cell Phone Use The accompanying...Ch. 11.2 - Ear Preference for Cell Phone Use 2. Hypotheses...Ch. 11.2 - Hypothesis Test The accompanying TI-83/84 Plus...Ch. 11.2 - Right-Tailed, Left-Tailed, Two-Tailed Is the...Ch. 11.2 - Prob. 5BSCCh. 11.2 - In Exercises 5-18, test the given claim. 6. Splint...Ch. 11.2 - In Exercises 5-18, test the given claim. 7....Ch. 11.2 - Prob. 8BSCCh. 11.2 - In Exercises 5-18, test the given claim. 9. Four...Ch. 11.2 - In Exercises 5-18, test the given claim. 10....Ch. 11.2 - In Exercises 5-18, test the given claim. 11....Ch. 11.2 - In Exercises 5-18, test the given claim. 12. Nurse...Ch. 11.2 - Soccer Strategy In soccer, serious fouls in the...Ch. 11.2 - In Exercises 5-18, lest the given claim. 14. Is...Ch. 11.2 - In Exercises 518, test the given claim. 15....Ch. 11.2 - In Exercises 5-18, test the given claim. 16....Ch. 11.2 - Prob. 17BSCCh. 11.2 - In Exercises 5-18, test the given claim. 18....Ch. 11.2 - In Exercises 5-18, lest the given claim. 19. Car...Ch. 11.2 - Is the Home Field Advantage Independent of the...Ch. 11.2 - Equivalent Tests A X2 test involving a 2 2 table...Ch. 11.2 - Using Yatess Correction for Continuity The...Ch. 11.3 - In Exercises 1-4, use the following listed arrival...Ch. 11.3 - In Exercises 1-4, use the following listed arrival...Ch. 11.3 - In Exercises 1-4, use the following listed arrival...Ch. 11.3 - In Exercises 1-4, use the following listed arrival...Ch. 11.3 - In Exercises 5-16, use analysis of variance for...Ch. 11.3 - In Exercises 5-16, use analysis of variance for...Ch. 11.3 - In Exercises 5-16, use analysis of variance for...Ch. 11.3 - In Exercises 5-16, use analysis of variance for...Ch. 11.3 - In Exercises 5-16, use analysis of variance for...Ch. 11.3 - Prob. 10BSCCh. 11.3 - Triathlon Times Jeff Parent is a statistics...Ch. 11.3 - Arsenic in Rice Listed below are amounts of...Ch. 11.3 - Prob. 13BSCCh. 11.3 - Speed Dating Listed below are attribute ratings of...Ch. 11.3 - Tukey Test A display of the Bonferroni test...Ch. 11.3 - Two-Way ANOVA The pulse rates in Table 12-3 from...Ch. 11 - Exercises 1-5 refer to the sample data in the...Ch. 11 - Exercises 15 refer to the sample data in the...Ch. 11 - Exercises 15 refer to the sample data in the...Ch. 11 - Prob. 4CQQCh. 11 - Exercises 15 refer to the sample data in the...Ch. 11 - Questions 610 refer to the sample data in the...Ch. 11 - Questions 610 refer to the sample data in the...Ch. 11 - Questions 6-10 refer to the sample data in the...Ch. 11 - Questions 6-10 refer to the sample data in the...Ch. 11 - Motor Vehicle Fatalities The table below lists...Ch. 11 - Tooth Fillings The table below shows results from...Ch. 11 - American Idol Contestants on the TV show American...Ch. 11 - Clinical Trial of Lipitor Lipitor is the trade...Ch. 11 - Weather-Related Deaths For a recent year, the...Ch. 11 - Weather-Related Deaths Review Exercise 5 involved...Ch. 11 - Chocolate and Happiness In a survey sponsored by...Ch. 11 - Chocolate and Happiness Use the results from part...Ch. 11 - Chocolate and Happiness Use the results from part...Ch. 11 - One Big Bill or Many Smaller Bills In a study of...Ch. 11 - 6. Probability Refer to the results from the 150...Ch. 11 - Car Repair Costs Listed below are repair costs (in...Ch. 11 - Forward Grip Reach and Ergonomics When designing...Ch. 11 - Use Statdisk, Minitab, Excel, StatCrunch, a...Ch. 11 - FROM DATA TO DECISION Critical Thinking: Was...Ch. 11 - Cola Weights Data Set 26 Cola Weights and Volumes...Ch. 11 - Speed Dating Data Set 18 Speed Dating in Appendix...Ch. 11 - Author Readability Pages were randomly selected by...
Knowledge Booster


Learn more about
Need a deep-dive on the concept behind this application? Look no further. Learn more about this topic, statistics and related others by exploring similar questions and additional content below.Similar questions
- You may need to use the appropriate technology to answer this question. An automobile dealer conducted a test to determine if the time in minutes needed to complete a minor engine tune-up depends on whether a computerized engine analyzer or an electronic analyzer is used. Because tune-up time varies among compact, intermediate, and full-sized cars, the three types of cars were us blocks in the experiment. The data obtained follow. Analyzer Computerized Electronic Compact 50 41 Car Intermediate 54 44 Full-sized 64 47 Use a = 0.05 to test for any significant differences. State the null and alternative hypotheses. O Ho: MCompact = "Intermediate = "Full-sized H: "Compact *"Intermediate * Full-sized O Ho: "Compact * "Intermediate * Full-sized H: "Compact = "Intermediate "Full-sized O Ho: "Computerized = HElectronic H: "Computerized * "Electronic O Ho: "Computerized = "Electronic = "Compact = 4Intermediate = "Full-sized H: Not all the population means are equal. O Ho: "Computerized *…arrow_forward"It is right to use animals for medical testing if it might save human lives." The General Social Survey asked 1126 adults to react to this statement. Here is the two-way table of their responses: Male Female Total Strongly Agree 60 57 117 Agree 230 247 477 Neither agree nor disagree 88 138 226 Disagree 77 125 202 Strongly disagree 38 66 104 Total 493 633 1126 Carry out the chi-square test for the hypothesis of no difference between the opinions of men and women.Find the χ2 test statistic and the P-value. (Round each number to 4 decimal places.) χ2 = P-value = What is your conclusion? There is strong evidence of a difference between the opinions of men and women.There is not strong evidence of a difference between the opinions of men and women.arrow_forwardYou may need to use the appropriate technology to answer this question. An automobile dealer conducted a test to determine if the time in minutes needed to complete a minor engine tune-up depends on whether a computerized engine analyzer or an electronic analyzer is used. Because tune-up time varies among compact, intermediate, and full-sized cars, the three types of cars were used as blocks in the experiment. The data obtained follow. Analyzer computerized electronic Car compact 50 41 Intermediate 56 45 Full Sized 62 46 Use ? = 0.05 to test for any significant differences. State the null and alternative hypotheses. H0: ?Computerized = ?ElectronicHa: ?Computerized ≠ ?ElectronicH0: ?Computerized ≠ ?ElectronicHa: ?Computerized = ?Electronic H0: ?Computerized = ?Electronic = ?Compact = ?Intermediate = ?Full-sizedHa: Not all the population means are equal.H0: ?Compact = ?Intermediate = ?Full-sizedHa: ?Compact ≠ ?Intermediate ≠ ?Full-sizedH0:…arrow_forward
- The data: a11=8 , a12=11 , a13=27 , a21=289 , a22=51 , a23=122 which is represented in the following table, were derived from a study of the effectiveness of a flu vaccine. The value in each cell of the table represents the number of individuals in that category. Some participants in the study were given no vaccine, some were given one injection, and some were given two injections. No Vaccine One Injection Two Injections Flu 8 11 27 No Flu 289 51 122 What is the probability that a person received two injections? Note: For any final answer that has up to four decimal places, enter your answer without rounding the number. For any answers with more than four decimal values, round your final answer to four decimal places.arrow_forwardAnswer the following with the red hightlights. Use the second image to determine the test procedure and p-valuearrow_forwardA survey asked Democrats, Republicans, and Independent voters what the most important message is to send to congress. One of the most popular responses for all three groups was to "focus on the economy". The number of respondents, the messages they want sent, and their party affiliations are shown in the following table: Message Democrat Republican Independent Focus on economy 55 61 59 Other 95 114 61 Total 150 175 120 a. Using α = 0.05, perform a chi-square test to determine if the proportion of voters who responded "focus on the economy" differ among the three groups of voters. b. Determine the p-value using Excel and interpret its meaning.arrow_forward
- Match each of the following research questions to the types of tests listed below. Enter the letter for the correct type of test next to each research questionarrow_forwardBefore the semester began, Professor Keithley predicted that 15% of hisphilosophy students would receive an A, 30% a B, 40% a C, 10% a D, and 5%an F. At the end of the semester, 14 of Professor Keithley’s philosophy studentsearned an A, 19 a B, 12 a C, 5 a D, and 2 an F.Use the Chi-Square test and a 0.05 level of significance to determine if ProfessorKeithley’s predicted percentages were accurate. (State your null and alternativehypothesis, find the critical values and test statistics, make a decision, and writea conclusion based on your results).arrow_forwardYou may need to use the appropriate technology to answer this question. An automobile dealer conducted a test to determine if the time in minutes needed to complete a minor engine tune-up depends on whether a computerized engine analyzer or an electronic analyzer is used. Because tune-up time varies among compact, intermediate, and full-sized cars, the three types of cars were used as blocks in the experiment. The data obtained follow. Analyzer Computerized Electronic Compact 50 41 Car Intermediate 54 44 Full-sized 64 47 Use a = 0.05 to test for any significant differences. State the null and alternative hypotheses. O Ho: MCompact = "Intermediate = HFull-sized H: "Compact * "Intermediate * "Full-sized O Ho: "Compact * "Intermediate * HFull-sized H: "Compact "Intermediate = "Full-sized O Ho: Computerized = HElectronic H: "Computerized * HElectronic O Ho: "Computerized = HElectronic = "Compact = Intermediate = Full-sized H: Not all the population means are equal. O Ho: HComputerized *…arrow_forward
- Please answer the part (b) of the question on the image uploadedarrow_forwardAn automobile dealer conducted a test to determine if the time in minutes needed to complete a minor engine tune-up depends on whether a computerized engine analyzer or an electronic analyzer is used. Because tune-up time varies among compact, intermediate, and full-sized cars, the three types of cars were used as blocks in the experiment. The data obtained follow. Analyzer Computerized Electronic Car Compact 51 42 Intermediate 55 43 Full-sized 62 47 Use ? = 0.05 to test for any significant differences. State the null and alternative hypotheses. H0: ?Computerized ≠ ?ElectronicHa: ?Computerized = ?ElectronicH0: ?Computerized = ?Electronic = ?Compact = ?Intermediate = ?Full-sizedHa: Not all the population means are equal. H0: ?Computerized = ?ElectronicHa: ?Computerized ≠ ?ElectronicH0: ?Compact ≠ ?Intermediate ≠ ?Full-sizedHa: ?Compact = ?Intermediate = ?Full-sizedH0: ?Compact = ?Intermediate = ?Full-sizedHa: ?Compact ≠ ?Intermediate ≠ ?Full-sized Find the value of…arrow_forwardPls answer the wrong ones.arrow_forward
arrow_back_ios
SEE MORE QUESTIONS
arrow_forward_ios
Recommended textbooks for you
 Algebra & Trigonometry with Analytic GeometryAlgebraISBN:9781133382119Author:SwokowskiPublisher:Cengage
 Linear Algebra: A Modern IntroductionAlgebraISBN:9781285463247Author:David PoolePublisher:Cengage Learning
 Holt Mcdougal Larson Pre-algebra: Student Edition...AlgebraISBN:9780547587776Author:HOLT MCDOUGALPublisher:HOLT MCDOUGAL
Algebra & Trigonometry with Analytic Geometry
Algebra
ISBN:9781133382119
Author:Swokowski
Publisher:Cengage
Linear Algebra: A Modern Introduction
Algebra
ISBN:9781285463247
Author:David Poole
Publisher:Cengage Learning
Holt Mcdougal Larson Pre-algebra: Student Edition...
Algebra
ISBN:9780547587776
Author:HOLT MCDOUGAL
Publisher:HOLT MCDOUGAL
Introduction to experimental design and analysis of variance (ANOVA); Author: Dr. Bharatendra Rai;https://www.youtube.com/watch?v=vSFo1MwLoxU;License: Standard YouTube License, CC-BY