
Concept explainers
Videos
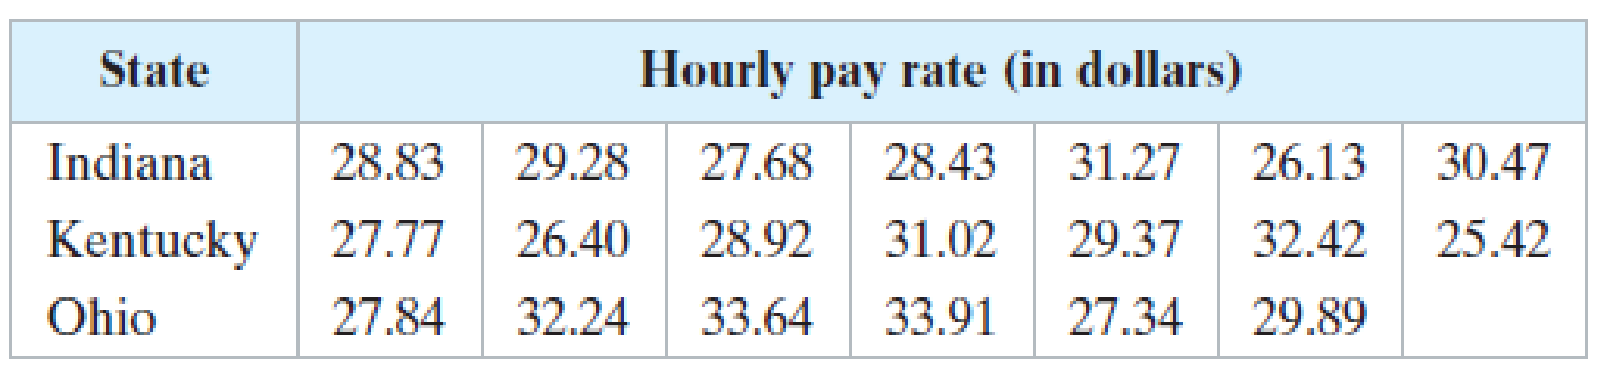
Performing a Kruskal-Wallis Test In Exercises 3–6, (a) identify the claim and state H0 and Ha. (b) find the critical value and identify the rejection region, (c) find the test statistic H, (d) decide whether to reject or fail to reject the null hypothesis, and (e) interpret the decision in the context of the original claim.
4. Hourly Rates A researcher wants to determine whether there is a difference in the hourly pay rates for registered nurses in Indiana, Kentucky, and Ohio. The researcher randomly selects several registered nurses in each state and records the hourly pay rate for each. The table shows the results. At a = 0.05, can the researcher conclude that the distribution of the hourly pay rates of registered nurses in at least one state is different from the others? (Adapted from U.S. Bureau of Labor Statistics)
Want to see the full answer?
Check out a sample textbook solution
Chapter 11 Solutions
Elementary Statistics: Picturing the World (7th Edition)


- Population Genetics In the study of population genetics, an important measure of inbreeding is the proportion of homozygous genotypesthat is, instances in which the two alleles carried at a particular site on an individuals chromosomes are both the same. For population in which blood-related individual mate, them is a higher than expected frequency of homozygous individuals. Examples of such populations include endangered or rare species, selectively bred breeds, and isolated populations. in general. the frequency of homozygous children from mating of blood-related parents is greater than that for children from unrelated parents Measured over a large number of generations, the proportion of heterozygous genotypesthat is, nonhomozygous genotypeschanges by a constant factor 1 from generation to generation. The factor 1 is a number between 0 and 1. If 1=0.75, for example then the proportion of heterozygous individuals in the population decreases by 25 in each generation In this case, after 10 generations, the proportion of heterozygous individuals in the population decreases by 94.37, since 0.7510=0.0563, or 5.63. In other words, 94.37 of the population is homozygous. For specific types of matings, the proportion of heterozygous genotypes can be related to that of previous generations and is found from an equation. For mating between siblings 1 can be determined as the largest value of for which 2=12+14. This equation comes from carefully accounting for the genotypes for the present generation the 2 term in terms of those previous two generations represented by for the parents generation and by the constant term of the grandparents generation. a Find both solutions to the quadratic equation above and identify which is 1 use a horizontal span of 1 to 1 in this exercise and the following exercise. b After 5 generations, what proportion of the population will be homozygous? c After 20 generations, what proportion of the population will be homozygous?arrow_forward(b) Find the critical value(s) and identify the rejection region(s). (c) Calculate d and sd. (d) Find the standardized test statistic t. (e) Decide whether to reject or fail to reject the null hypothesis and interpret the decision in the context of the original claim.arrow_forwarda) State the null and alternative hypothesisb) Determine the critical value by using t-tablec) Determine the rejection regiond) Calculate the Test statisticarrow_forward
- (a) Identify the claim and state H0 and Ha. (b) Find the critical value(s) and identify the rejection region(s). (c) Find the standardized test statistic z. (d) Decide whether to reject or fail to reject the null hypothesis and (e) interpret the decision in the context of the original claim.arrow_forwardTesting Claims About Variation. In Exercises 5–16, test the given claim. Identify the null hypothesis, alternative hypothesis, test statistic, P-value, or critical value(s), then state the conclusion about the null hypothesis, as well as the final conclusion that addresses the original claim. Assume that a simple random sample is selected from a normally distributed population. Bank Lines The Jefferson Valley Bank once had a separate customer waiting line at each teller window, but it now has a single waiting line that feeds the teller windows as vacancies occur. The standard deviation of customer waiting times with the old multiple-line configuration was 1.8 min. Listed below is a simple random sample of waiting times (minutes) with the single waiting line. Use a 0.05 significance level to test the claim that with a single waiting line, the waiting times have a standard deviation less than 1.8 min. What improvement occurred when banks changed from multiple waiting lines to a single…arrow_forwardNeutropenia. Neutropenia is an abnormally low number of neutrophils (a type of white blood cell) in the blood. Chemotherapy often reduces the number of neutrophils to a level that makes patients susceptible to fever and infections. G. Bucaneve et al. published a study of such cancer patients in the paper “Levofloxacin to Prevent Bacterial Infection in Patients With Cancer and Neutropenia” (New England Journal of Medicine, Vol. 353, No. 10, pp. 977–987). For the study, 375 patients were randomly assigned to receive a daily dose of levofloxacin, and 363 were given placebo. In the group receiving levofloxacin, fever was present in 243 patients for the duration of neutropenia, whereas fever was experienced by 308 patients in the placebo group. a. At the 1% significance level, do the data provide sufficient evidence to conclude that levofloxacin is effective in reducing the occurrence of fever in such patients? b. Find a 98% confidence level for the difference in the proportions of such…arrow_forward
- Using the students’ T test determine whether test agent causes significant inhibition of colony formationarrow_forwardExercise 4.3 Two measurement methods are used to evaluate the surface smoothness of a paper product. Let X and Y denote the measurements of each of the two methods. Suppose that the joint p.d.f of X and Y is modeled by fxy (x, y) = c, 0 <x <4, 0<y and x-1 < y <x+1 Determine the value of c. Determine the marginal probability distribution of X. Find also the mean and variance of X. Determine the conditional probability distribution of Y given X=2. Find also the conditional mean and conditional variance of Y given X=2 Check if the measurements of the two methods X and Y are independent. * SHOW COMPLETE SOLUTION WITH GIVEN, REQUIRED, AND SOLUTION. SHOW TABLE OF ILLUSTRATIONS IF NECESSARY.arrow_forwardFind the critical value(s) and identify the rejection region(s). (c) Calculate d. Calculate sd. (d) Use the t-test to find the standardized test statistic t. (e) Decide whether to reject or fail to reject the null hypothesis. (f) Interpret the decision in the context of the original claim.arrow_forward
- Testing Claims About Variation. In Exercises 5–16, test the given claim. Identify the null hypothesis, alternative hypothesis, test statistic, P-value, or critical value(s), then state the conclusion about the null hypothesis, as well as the final conclusion that addresses the original claim. Assume that a simple random sample is selected from a normally distributed population. Fast Food Drive-Through Service Times Listed below are drive-through service times (seconds) recorded at McDonald’s during dinner times (from Data Set 25 “Fast Food” in Appendix B). Assuming that dinner service times at Wendy’s have standard deviation σ = 55.93 sec, use a 0.01 significance level to test the claim that service times at McDonald’s have the same variation as service times at Wendy’s. Should McDonald’s take any action?arrow_forward(b) Find the critical value(s) and identify the rejection region(s). (c) Find the standardized test statistic, z. (d) Decide whether to reject or fail to reject the null hypothesis. (e) Interpret the decision in the context of the original claim.arrow_forward(a) Identify the claim and state H0 and Ha. b. Find the critical value(s) and identify the rejection region(s). c. Find the standardized test statistic. (d) Decide whether to reject or fail to reject the null hypothesis. (e) Interpret the decision in the context of the original claim.arrow_forward
 Functions and Change: A Modeling Approach to Coll...AlgebraISBN:9781337111348Author:Bruce Crauder, Benny Evans, Alan NoellPublisher:Cengage Learning