
Concept explainers
Videos
a.
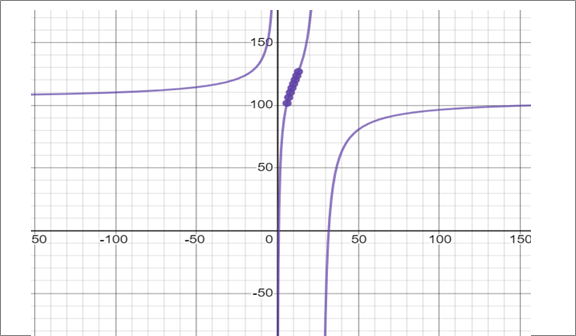
To create: a scatter plot of data and graph the model in the same viewing window and how do they compare.
a.
Answer to Problem 60E
Explanation of Solution
Given information: A model for the data is given by:
Where t represents the year, with t = 6 corresponding to 2006.
Calculation:
The graph of the model is shown below.
b.
To predict: the mean salaries in 2018 and 2019.
b.
Answer to Problem 60E
Explanation of Solution
Given information:
Calculation:
c.
To find: the limit of the model as
c.
Answer to Problem 60E
As time passes, the mean annual salaries of a financial manager in United States approach 0.
Explanation of Solution
Given information:
Calculation:
As time passes, the mean annual salaries of a financial manager in United States approach 0.
d.
To find: is this a good model for predicting the mean annual salaries in future years.
d.
Answer to Problem 60E
No, this model is not a good model for predicting the mean annual salaries in future years because
Explanation of Solution
Given information:
Calculation:
No, this model is not a good model for predicting the mean annual salaries in future years because
Chapter 11 Solutions
PRECALCULUS W/LIMITS:GRAPH.APPROACH(HS)


 Calculus: Early TranscendentalsCalculusISBN:9781285741550Author:James StewartPublisher:Cengage Learning
 Thomas' Calculus (14th Edition)CalculusISBN:9780134438986Author:Joel R. Hass, Christopher E. Heil, Maurice D. WeirPublisher:PEARSON
 Calculus: Early Transcendentals (3rd Edition)CalculusISBN:9780134763644Author:William L. Briggs, Lyle Cochran, Bernard Gillett, Eric SchulzPublisher:PEARSON
 Calculus: Early TranscendentalsCalculusISBN:9781319050740Author:Jon Rogawski, Colin Adams, Robert FranzosaPublisher:W. H. Freeman
 Calculus: Early Transcendental FunctionsCalculusISBN:9781337552516Author:Ron Larson, Bruce H. EdwardsPublisher:Cengage Learning