
Concept explainers
Videos
a.
Construct the 95% confidence interval for the mean response when
a.
Answer to Problem 7E
The 95% confidence interval for the mean response when
Explanation of Solution
Calculation:
The given information is that, the sample size is 25 and parameter estimates are given below:
Construction of confidence interval:
Where,
A particular value of
From the given information the predicted value is calculated as follows:
Substitute
Thus, the predicted value
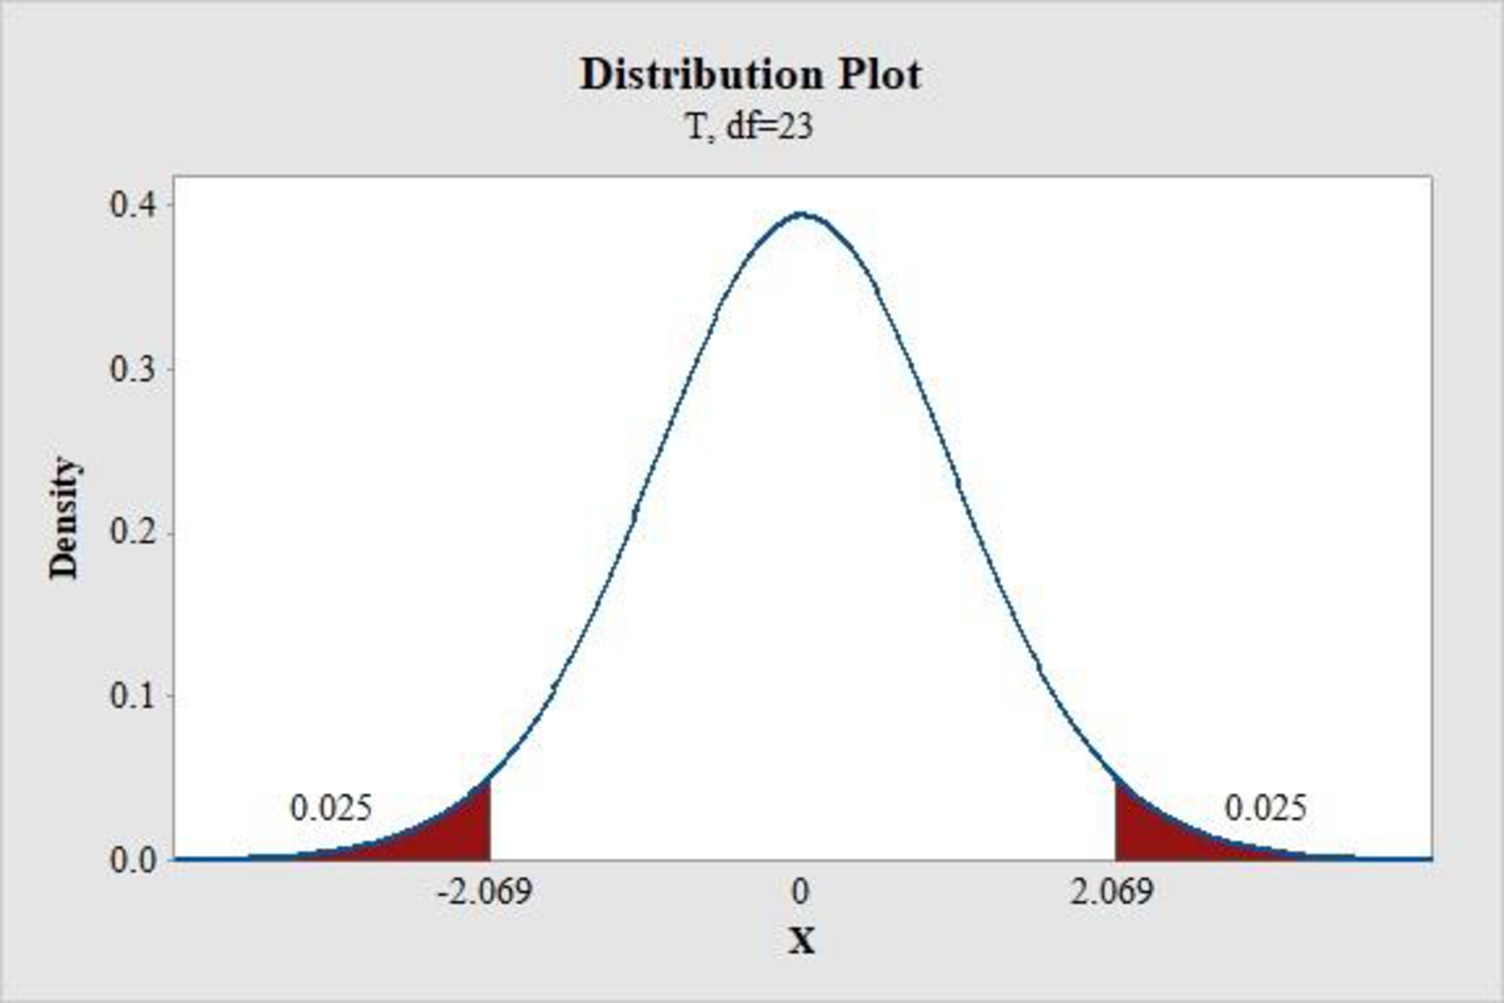
Critical value:
Software procedure:
Step-by-step procedure to find the critical value using MINITAB is given below:
- Choose Graph > Probability Distribution Plot choose View Probability > OK.
- From Distribution, choose ‘t’ distribution.
- In Degrees of freedom, enter 23.
- Click the Shaded Area tab.
- Choose Probability and Two tail for the region of the curve to shade.
- Enter the Probability value as 0.05.
- Click OK.
Output obtained from MINITAB is given below:
95% confidence interval is calculated as follows:
Substitute
Thus, the 95% confidence interval is
b.
Construct the 95% prediction interval for the individual response when
b.
Answer to Problem 7E
The 95% prediction interval for the individual response when
Explanation of Solution
Calculation:
The given information is that the sample size is 25 and parameter estimates are given below:
Construction of prediction interval:
Where,
A particular value of
From the given information the predicted value is calculated as follows:
Substitute
Thus, the predicted value
95% prediction interval is calculated as follows:
Substitute
Thus, the 95% prediction interval is
Want to see more full solutions like this?
Chapter 11 Solutions
ALEKS 360 ESSENT. STAT ACCESS CARD


 Glencoe Algebra 1, Student Edition, 9780079039897...AlgebraISBN:9780079039897Author:CarterPublisher:McGraw Hill