
Videos
Instructions: For each data set: (a) State the hypotheses. (b) Use Excel’s Data Analysis (or other software) to perform the two-factor ANOVA with replication, using a = .05. (c) State your conclusions about the main effects and interaction effects. (d) Interpret the p-values carefully. Ambitious students: (e*) Create interaction plots and interpret them.
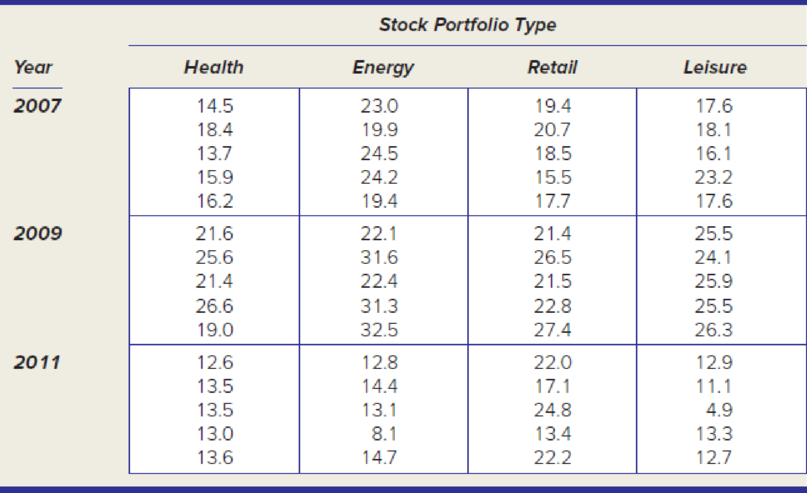
A small independent stock broker has created four sector portfolios for her clients. Each portfolio always has five stocks that may change from year to year. The volatility (coefficient of variation) of each stock is recorded for each year. Are the main effects significant? Is there an interaction?
Want to see the full answer?
Check out a sample textbook solution
Chapter 11 Solutions
APPLIED STAT.IN BUS.+ECONOMICS
Additional Math Textbook Solutions
Elementary Statistics (Text Only)
Statistical Reasoning for Everyday Life (5th Edition)
An Introduction to Mathematical Statistics and Its Applications (6th Edition)
Statistics for Business & Economics, Revised (MindTap Course List)
Stats: Modeling the World Nasta Edition Grades 9-12
Elementary Statistics: A Step By Step Approach


- Morgan City Fire Chief Sidney Pyro is concerned about the low efficiency scores that his firefighters receive at the state testing institute. Chief Pyro believes that these scores result because some firefighters are not in good physical condition. Pyro orders 75 randomly selected firefighters to participate in an hour of exercise per day. Another 200 firefighters have no required exercise. After 60 days, all firefighters are tested again by the state. Chief Pyro collects the data and performs a two-sample independent t-test by using SPSS to examine if there is a statistically significant difference between the treatment and control groups; the SPSS results are shown in the table below. Group Statistics Groups N Mean Std. Deviation Std. Error Mean Test Scores Treatment 75 74.5 31.4 3.6 Control 200 70.6 26.3 1.9 a. Formulate a null and research hypothesis: H0: H1: Collect all the necessary data: Mean score of the treatment group:…arrow_forwardMorgan City Fire Chief Sidney Pyro is concerned about the low efficiency scores that his firefighters receive at the state testing institute. Chief Pyro believes that these scores result because some firefighters are not in good physical condition. Pyro orders 75 randomly selected firefighters to participate in an hour of exercise per day. Another 200 firefighters have no required exercise. After 60 days, all firefighters are tested again by the state. Chief Pyro collects the data and performs a two-sample independent t-test by using SPSS to examine if there is a statistically significant difference between the treatment and control groups; the SPSS results are shown in the table below. Groups N Mean Std. Deviation Std. Error Mean Test Scores Treatment 75 74.5 31.4 3.6 Control 200 70.6 26.3 1.9 Formulate a null and research hypothesis: H0: H1: Collect all the necessary data: Mean score of the treatment group: Mean score of the control group: Sample size of the…arrow_forwardWhy is a cohort design more efficient than a case-control design to study a rare exposure? (Select one best answer) Group of answer choices a. Subjects are selected based on their exposure status. b. Subjects are selected based on their disease status. c. Subjects are selected based on their exposure and disease status. d. Subjects are selected based on their random allocation to treatment or placebo. e. None of these.arrow_forward
- Q1: Adolescent obesity is a serious health risk affecting more than 5 million young people in the United States alone. Laparoscopic adjustable gastric banding has the potential to provide a safe and effective treatment. Fifty adolescents between 14 and 18 years old with a body mass index higher than 35 were recruited from the Melbourne, Australia, community for the study. Twenty-five were randomly selected to undergo gastric banding, and the remaining 25 were assigned to a supervised lifestyle intervention program involving diet, exercise, and behavior modification. All subjects were followed for two years. b. Without assuming the two groups having equal variances, give a 95% confidence interval for the mean weight loss difference between the gastric banding and intervention group. c. Test if gastric banding leads to greater weight loss than the lifestyle intervention program, give H0, Ha, test statistic, p-value, conclusion and 95% CI for the mean weight loss difference. d. Now…arrow_forwardQ1: Adolescent obesity is a serious health risk affecting more than 5 million young people in the United States alone. Laparoscopic adjustable gastric banding has the potential to provide a safe and effective treatment. Fifty adolescents between 14 and 18 years old with a body mass index higher than 35 were recruited from the Melbourne, Australia, community for the study. Twenty-five were randomly selected to undergo gastric banding, and the remaining 25 were assigned to a supervised lifestyle intervention program involving diet, exercise, and behavior modification. All subjects were followed for two years. Ex21-48ADOBESE.jmp gives the weight losses, in kilograms, for the subjects who completed the study. a. Get the 5-number summaries and mean, s.d for each group. b. Without assuming the two groups having equal variances, give a 95% confidence interval for the mean weight loss difference between the gastric banding and intervention group. c. Test if gastric banding leads to greater…arrow_forwardA U.S. study published in The American Journal of Preventive Medicine compared state-level prevalence of firearm ownership in 2002 with state-level rates of firearm assault and firearm robbery in the subsequent year. The investigators found a positive association - meaning that states with higher prevalence of firearm ownership also tended to be the states with higher rates of firearm assault. Which design best describes this study? a)Observational cohort study b)Randomized trial c)Case-control study d)Ecological studyarrow_forward
- What is the shape of the sampling distribution of r? In what way does the shape depend on the size of the population correlation?arrow_forwardIn an attempt to cut university expenditure, the Dean at a University inquires about reducing the four month training period of dogs at the BCIE. The trainers at the BCIE agree with the proposal but only if the dogs can reach the 70% success threshold that is required of dogs working with anxiety patients. The trainers design an experiment in which they measure the training success of 20 dogs after one month, two months, three months and four months of training. The attached CSV file contains the data that was collected for this experiment. What can you conclude from the results of this experiment? Results: (please check attache picture ) I would love help with: Reporting the complete results (including assumption checks) in APA style.arrow_forwardIn an attempt to cut university expenditure, the Dean at a University inquires about reducing the four month training period of dogs at the BCIE. The trainers at the BCIE agree with the proposal but only if the dogs can reach the 70% success threshold that is required of dogs working with anxiety patients. The trainers design an experiment in which they measure the training success of 20 dogs after one month, two months, three months and four months of training. The attached CSV file contains the data that was collected for this experiment. What can you conclude from the results of this experiment? I would love help with: Identifying the appropriate statistical test. Conducting the statistical test in JASP, Excel or SPSS. Reporting the complete results (including assumption checks) in APA style. Interpreting the results. Attachment of the JASP, Excel or SPSS output file. Thank you!arrow_forward
- A development corporation purchased land that will be the site of a new luxury condominium complex. Management is considering a six month market research study designed to learn more about potential market acceptance of the condominium project. Management anticipates that, if conducted, the market research study will provide one of the following two results. 1. Favorable report (F): A significant number of the individuals contacted express interest in purchasing a condominium. 2. Unfavorable report (U): Very few of the individuals contacted express interest in purchasing a condo- minium. After deciding whether to conduct the market research study, they have the following two decision alternatives. d1 = a small complex with 30 condominiumsd2 = a medium complex with 60 condominiumsFollowing this, a chance event concerning the demand for the condominiums has two states of nature. s1 = strong demand for the condominiumss2 = weak demand for the condominiumsThe payoffs, probabilities, and…arrow_forwardA development corporation purchased land that will be the site of a new luxury condominium complex. Management is considering a six month market research study designed to learn more about potential market acceptance of the condominium project. Management anticipates that, if conducted, the market research study will provide one of the following two results. 1. Favorable report (F): A significant number of the individuals contacted express interest in purchasing a condominium. 2. Unfavorable report (U): Very few of the individuals contacted express interest in purchasing a condo- minium. After deciding whether to conduct the market research study, they have the following two decision alternatives. d1 = a small complex with 30 condominiumsd2 = a medium complex with 60 condominiumsFollowing this, a chance event concerning the demand for the condominiums has two states of nature. s1 = strong demand for the condominiumss2 = weak demand for the condominiumsThe payoffs, probabilities, and…arrow_forward1. Sarah wants to know how gender impacts heart rate recovery after a maximal exercise test. In order to test this, she has both male and female athletes come into her lab and she measures both resting heart rate before the exercise test and heart rate immediately, 10 minutes, 20 minutes and 30 minutes following the exercise test. In order for her to determine whether heart rate differs pre-post exercise between males and females what statistical test might she use? 2. Dahlia is interested in how depression impacts willingness to exercise and go to the gym. In order to do this, she has to have a large sample size, so she decides to send out a survey to all college students at SUNY Cortland. Once she receives 80% of the surveys back from the students she begins to record the data. Because of the responses to her questionnaires, she will not have normally distributed data. In this case, what might be the best statistical test to use to determine whether going to the gym/willingness…arrow_forward
 MATLAB: An Introduction with ApplicationsStatisticsISBN:9781119256830Author:Amos GilatPublisher:John Wiley & Sons Inc
 Probability and Statistics for Engineering and th...StatisticsISBN:9781305251809Author:Jay L. DevorePublisher:Cengage Learning
 Statistics for The Behavioral Sciences (MindTap C...StatisticsISBN:9781305504912Author:Frederick J Gravetter, Larry B. WallnauPublisher:Cengage Learning
 Elementary Statistics: Picturing the World (7th E...StatisticsISBN:9780134683416Author:Ron Larson, Betsy FarberPublisher:PEARSON
 The Basic Practice of StatisticsStatisticsISBN:9781319042578Author:David S. Moore, William I. Notz, Michael A. FlignerPublisher:W. H. Freeman
 Introduction to the Practice of StatisticsStatisticsISBN:9781319013387Author:David S. Moore, George P. McCabe, Bruce A. CraigPublisher:W. H. Freeman