Loose-leaf For Applied Statistics In Business And Economics
5th Edition
ISBN: 9781259328527
Author: David Doane, Lori Seward Senior Instructor of Operations Management
Publisher: McGraw-Hill Education
bartleby

Videos

Textbook Question
Book Icon
Chapter 11.6, Problem 26SE

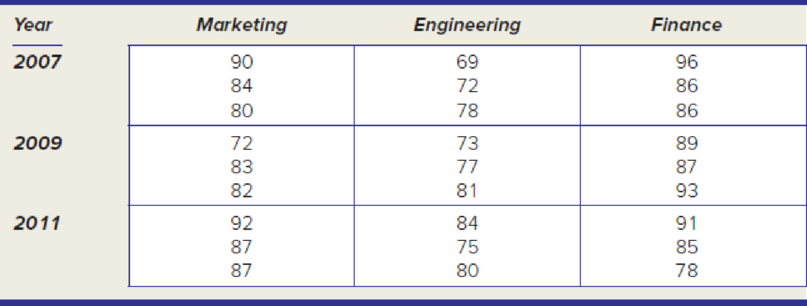
Instructions: For each data set: (a) State the hypotheses. (b) Use Excel’s Data Analysis (or other software) to perform the two-factor ANOVA with replication, using α = .05. (c) State your conclusions about the main effects and interaction effects. (d) Interpret the p-values carefully. Ambitious students: (e*) Create interaction plots and interpret them.

Oxnard Petro, Ltd., has three interdisciplinary project development teams that function on an ongoing basis. Team members rotate from time to time. Every 4 months (three times a year) each department head rates the performance of each project team (using a 0 to 100 scale, where 100 is the best rating). Are the main effects significant? Is there an interaction?

Chapter 11.6, Problem 26SE, Instructions: For each data set: (a) State the hypotheses. (b) Use Excels Data Analysis (or other

Blurred answer
Students have asked these similar questions
A community college professor is interested in determining the relationship between the number of posts students make on Schoology and their respective grades. He planned to correlate the results from a sample from all his classes, however, due to time constraints, he decided to sample only from students with high grades. As his statistical consultant, state whether or not you support his plans and why.
A snack company is switching to environmentally friendly bags for its potato chips. The company is testing whether thenew bags are too hard to open.Product testers ask 25 randomly chosen subjects to open the new bags and another 25 randomly chosen subjects to open the old bags. They note the time it takes all subjects to open the bags. What type of data collection method was used here?
A researcher conducts a study examining how the brain chemical serotonin is related to aggression. One sample of rats serves as a control group and receives a placebo that does not affect normal levels of serotonin. A second sample of rats receives a drug that lowers brain levels of serotonin. Then the researcher records the number of aggressive responses each of the rats displays in a test. The sample statistics are as follows. Control:  =n1=10    -x1=14 ss1 =180.5 Low Serotonin:   n2=15    -x2=19 ss2=130.0   Does the drug have a significant effect on aggression? Use level of .05.                                Compute the 95% confidence interval estimate on the difference in the mean aggression between the control and the experiment condition. Interpret the result.                            Compute the effect size and interpret the result.

Chapter 11 Solutions

Loose-leaf For Applied Statistics In Business And Economics

Ch. 11.3 - Instructions for Exercises 11.11 through 11.14:...Ch. 11.3 - Prob. 12SECh. 11.3 - Prob. 13SECh. 11.3 - Prob. 14SECh. 11.4 - In a one-factor ANOVA with n1 = 6, n2 = 4, and n3...Ch. 11.4 - Prob. 16SECh. 11.4 - Instructions for Exercises 11.17 through 11.20:...Ch. 11.4 - Instructions for Exercises 11.17 through 11.20:...Ch. 11.4 - Instructions for Exercises 11.17 through 11.20:...Ch. 11.4 - Instructions for Exercises 11.17 through 11.20:...Ch. 11.5 - Instructions: For each data set: (a) State the...Ch. 11.5 - Instructions: For each data set: (a) State the...Ch. 11.5 - Instructions: For each data set: (a) State the...Ch. 11.5 - Instructions: For each data set: (a) State the...Ch. 11.6 - Instructions: For each data set: (a) State the...Ch. 11.6 - Instructions: For each data set: (a) State the...Ch. 11.6 - Prob. 27SECh. 11.6 - Prob. 28SECh. 11 - Explain each term: (a) explained variation; (b)...Ch. 11 - (a) Explain the difference between one-factor and...Ch. 11 - (a) State three assumptions of ANOVA. (b) What do...Ch. 11 - (a) Sketch the format of a one-factor ANOVA data...Ch. 11 - (a) Sketch the format of a two-factor ANOVA data...Ch. 11 - (a) Sketch the format of a two-factor ANOVA data...Ch. 11 - Prob. 7CRCh. 11 - (a) What does a test for homogeneity of variances...Ch. 11 - What is the general linear model and why is it...Ch. 11 - (a) What is a 2k design, and what are its...Ch. 11 - Instructions: You may use Excel, MegaStat,...Ch. 11 - Instructions: You may use Excel, MegaStat,...Ch. 11 - Instructions: You may use Excel, MegaStat,...Ch. 11 - Instructions: You may use Excel, MegaStat,...Ch. 11 - Instructions: You may use Excel, MegaStat,...Ch. 11 - Instructions: You may use Excel, MegaStat,...Ch. 11 - Instructions: You may use Excel, MegaStat,...Ch. 11 - Instructions: You may use Excel, MegaStat,...Ch. 11 - Instructions: You may use Excel, MegaStat,...Ch. 11 - Instructions: You may use Excel, MegaStat,...Ch. 11 - Instructions: You may use Excel, MegaStat,...Ch. 11 - Instructions: You may use Excel, MegaStat,...Ch. 11 - Instructions: You may use Excel, MegaStat,...Ch. 11 - Instructions: You may use Excel, MegaStat,...Ch. 11 - Instructions: You may use Excel, MegaStat,...Ch. 11 - Instructions: You may use Excel, MegaStat,...Ch. 11 - Instructions: You may use Excel, MegaStat,...Ch. 11 - In a market research study, members of a consumer...Ch. 11 - Prob. 47CECh. 11 - (a) What kind of ANOVA is this (one-factor,...Ch. 11 - Here is an Excel ANOVA table for an experiment to...Ch. 11 - Several friends go bowling several times per...Ch. 11 - Air pollution (micrograms of particulate per ml of...Ch. 11 - A company has several suppliers of office...Ch. 11 - Several friends go bowling several times per...Ch. 11 - Are large companies more profitable per dollar of...
Knowledge Booster
Background pattern image
Statistics
Learn more about
Need a deep-dive on the concept behind this application? Look no further. Learn more about this topic, statistics and related others by exploring similar questions and additional content below.
Recommended textbooks for you
Text book image
Calculus For The Life Sciences
Calculus
ISBN:9780321964038
Author:GREENWELL, Raymond N., RITCHEY, Nathan P., Lial, Margaret L.
Publisher:Pearson Addison Wesley,
Text book image
Glencoe Algebra 1, Student Edition, 9780079039897...
Algebra
ISBN:9780079039897
Author:Carter
Publisher:McGraw Hill
Text book image
Big Ideas Math A Bridge To Success Algebra 1: Stu...
Algebra
ISBN:9781680331141
Author:HOUGHTON MIFFLIN HARCOURT
Publisher:Houghton Mifflin Harcourt
Text book image
College Algebra
Algebra
ISBN:9781938168383
Author:Jay Abramson
Publisher:OpenStax
Hypothesis Testing using Confidence Interval Approach; Author: BUM2413 Applied Statistics UMP;https://www.youtube.com/watch?v=Hq1l3e9pLyY;License: Standard YouTube License, CC-BY
Hypothesis Testing - Difference of Two Means - Student's -Distribution & Normal Distribution; Author: The Organic Chemistry Tutor;https://www.youtube.com/watch?v=UcZwyzwWU7o;License: Standard Youtube License