
Videos
Interpretation:
The evolution of phase and its compositions are to be described during the process along with the feasibility of carrying this process. The device needed to carry this process is to be determined. Also, the change in total volume of system during the process is to be estimated along with the composition at which the volume will reach its maximum value.
Concept Introduction:
In a
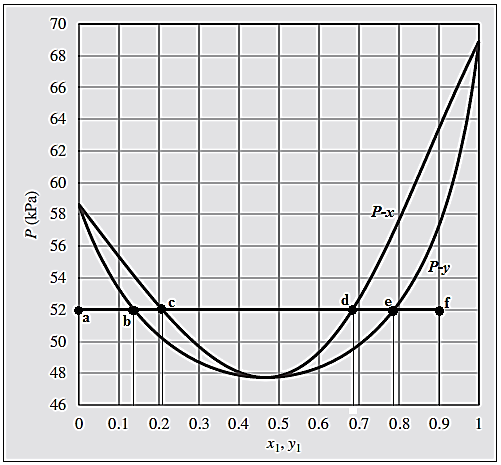
All the points that lies in between these curves are in two-phase region, where saturated liquid and saturated vapor coexist in equilibrium. At the edge of the
Answer to Problem 12.21P
For the given process, the phase evaluation is done along the horizontal straight line from point “a” to point “f”.
At point “a”, the system is in superheated vapor state with composition
At point “b” where first drop of saturated liquid appears and both saturated liquid and saturated vapor coexist in equilibrium. Phase composition at point “b” becomes:
At point “c”, last bubble of the saturated vapor condenses, and system is in saturated liquid state.
The composition of the system at this point “c” will be:
All the points lying on the straight-line connecting points “b” and “c” coexist in both the phases in equilibrium with total composition of the system varying from
Between points “c” and “d” the system is in superheated vapor state with composition range of
At this point “d”, the system reaches the state of saturated liquid. At this point, first bubble of saturated vapor appears which in equilibrium with the saturated liquid.
The composition of the system at this point “d” will be:
At point “e”, last drop of the saturated liquid evaporates, and system is in saturated vapor state.
The composition of the system at this point “e” will be:
In between the points “d” and “e”, both the phases saturated vapor and saturated liquid coexist in equilibrium and overall composition of the system varies as moving from “d” and “e”.
At point “f” where there is
The given process is not practically feasible.
There is no device which can be used to carry out such processes.
There is a proportional increase in the volume of the system with the increase in the total moles of the system.
The volume will reach maximum at the highest number of moles present in the system at which the composition of the system will be:
Explanation of Solution
Given information:
Below shown is the
Initially, there is
Now, keeping the temperature and pressure of the system constant, pure chloroform is slowly added to the vessel until there is
On a
Point “a” lies below the
Slow addition of pure chloroform gradually shifts the system from point “a” to point “b” where is touches
Therefore, the composition at this point “b” will be:
At point “c”, last bubble of the saturated vapor condenses, and system is in saturated liquid state. Point “c” corresponds to the composition of the saturated liquid and point “b” corresponds to the composition of the last bubble (saturated vapor) which is in equilibrium with this saturated liquid.
The composition of the system at this point “c” will be:
In between the points “b” and “c”, both the phases saturated vapor and saturated liquid coexist in equilibrium and overall composition of the system varies as moving from “b” and “c”.
Addition of chloroform beyond point “c” leads the system to point “d”
In this range the system is in subcooled liquid state with overall composition of the system varying from
At this point “d”, the system reaches the state of saturated liquid as it is on the curve
The composition of the system at this point “d” will be:
At point “e”, which lies on
The composition of the system at this point “e” will be:
In between the points “d” and “e”, both the phases saturated liquid and saturated vapor coexist in equilibrium and overall composition of the system varies as moving from “d” and “e”.
Further addition of pure chloroform to the vessel takes the system to point “f” where there is
For a two-phase binary system, degree of freedom is
Therefore, the given process is not practically feasible.
Since, the given process is not practically feasible, there is no device which can be used to carry out such processes.
As temperature and pressure of the system is kept constant throughout the process, there will be proportional increase in the volume of the system as number of moles are increasing with the addition of pure ethanol in the vessel.
Since, the increase in the system volume is proportional to the moles added to the system, the maximum volume will appear at the highest number of moles present in the system, that is,
The evolution of phase and its compositions are described during the process along with the feasibility of carrying this process.
The device needed to carry this process is determined.
The change in total volume of system during the process is estimated along with the composition at which the volume will reach its maximum value.
Want to see more full solutions like this?
Chapter 12 Solutions
INTRO.CHEMICAL ENGR.THERMODYN.>CUSTOM<


 Introduction to Chemical Engineering Thermodynami...Chemical EngineeringISBN:9781259696527Author:J.M. Smith Termodinamica en ingenieria quimica, Hendrick C Van Ness, Michael Abbott, Mark SwihartPublisher:McGraw-Hill Education
 Elementary Principles of Chemical Processes, Bind...Chemical EngineeringISBN:9781118431221Author:Richard M. Felder, Ronald W. Rousseau, Lisa G. BullardPublisher:WILEY
 Elements of Chemical Reaction Engineering (5th Ed...Chemical EngineeringISBN:9780133887518Author:H. Scott FoglerPublisher:Prentice Hall
 Industrial Plastics: Theory and ApplicationsChemical EngineeringISBN:9781285061238Author:Lokensgard, ErikPublisher:Delmar Cengage Learning
 Unit Operations of Chemical EngineeringChemical EngineeringISBN:9780072848236Author:Warren McCabe, Julian C. Smith, Peter HarriottPublisher:McGraw-Hill Companies, The