
Concept explainers
Videos
To check: Whether there is sufficient evidence to conclude a difference in means.
To perform: The appropriate test to find out where the difference in means if there is sufficient evidence to conclude a difference in means
Answer to Problem 15CQ
Yes, there is sufficient evidence to conclude a difference in means.
There is significant difference between the means “Asia and Europe” and “Asia and Africa”.
Explanation of Solution
Given info:
The table shows the particulate matter for prominent cities of three continents. The level of significance is 0.05.
Calculation:
The hypotheses are given below:
Null hypothesis:
Alternative hypothesis:
Here, at least one mean is different from the others is tested. Hence, the claim is that, at least one mean is different from the others.
The level of significance is 0.05. The number of samples k is 3, the sample sizes
The degrees of freedom are
Where
Substitute 3 for k in
Substitute 11 for N and 3 for k in
Critical value:
The critical F-value is obtained using the Table H: The F-Distribution with the level of significance
Procedure:
- Locate 8 in the degrees of freedom, denominator row of the Table H.
- Obtain the value in the corresponding degrees of freedom, numerator column below 2.
That is, the critical value is 4.46.
Rejection region:
The null hypothesis would be rejected if
Software procedure:
Step-by-step procedure to obtain thetest statistic using the MINITAB software:
- Choose Stat > ANOVA > One-Way.
- In Response, enter the Gasoline prices.
- In Factor, enter the Factor.
- Click OK.
Output using the MINITAB software is given below:
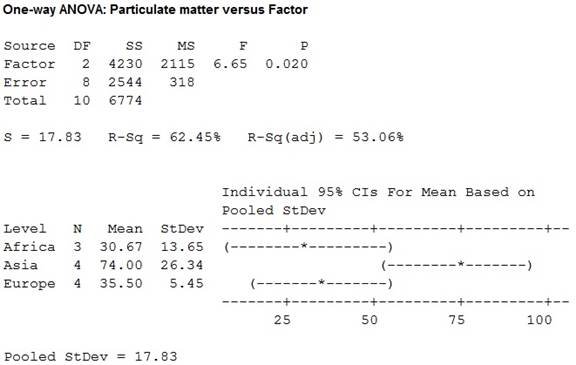
From the MINITAB output, the test value F is 6.65.
Conclusion:
From the results, the test value is 6.65.
Here, the F-statistic value is greater than the critical value.
That is,
Thus, it can be concluding that, the null hypothesis is rejected.
Hence, the result concludes that, there is sufficient evidence to conclude a difference in means.
Consider,
Step-by-step procedure to obtain the test mean and standard deviation using the MINITAB software:
- Choose Stat > Basic Statistics > Display
Descriptive Statistics . - In Variables enter the columns Asia, Europe and Africa.
- Choose option statistics, and select Mean, Variance and N total.
- Click OK.
Output using the MINITAB software is given below:
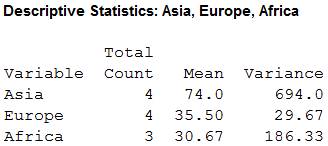
The sample sizes
The means are
The sample variances are
Here, the samples of sizes of three states are not equal. So, the test used here is Scheffe test.
Tukey test:
Critical value:
The formula for critical value F1 for the Scheffe test is,
Here, the critical value of F test is 4.46.
Substitute 4.46 for critical value is of F and 2 for k-1 in
Comparison of the means:
The formula for finding
That is,
Comparison between the means
The hypotheses are given below:
Null hypothesis:
Alternative hypothesis:
Rejection region:
The null hypothesis would be rejected if absolute value greater than the critical value.
The formula for comparing the means
Substitute 74.0 and 35.50 for
Thus, the value of
Conclusion:
The value of
Here, the value of
That is,
Thus, the null hypothesis is rejected.
Hence, there is significant difference between the means
Comparison between the means
The hypotheses are given below:
Null hypothesis:
Alternative hypothesis:
Rejection region:
The null hypothesis would be rejected if absolute value greater than the critical value.
The formula for comparing the means
Substitute 74.0 and 30.67 for
Thus, the value of
Conclusion:
The value of
Here, the value of
That is,
Thus, the null hypothesis is rejected.
Hence, there is significant difference between the means
Comparison between the means
The hypotheses are given below:
Null hypothesis:
Alternative hypothesis:
Rejection region:
The null hypothesis would be rejected if absolute value greater than the critical value.
The formula for comparing the means
Substitute 35.50 and 30.67 for
Thus, the value of
Conclusion:
The value of
Here, the value of
That is,
Thus, the null hypothesis is not rejected.
Hence, there is no significant difference between the means
Justification:
Here, there is significant difference between the means
Want to see more full solutions like this?
Chapter 12 Solutions
Elementary Statistics: A Step-by-Step Approach with Formula Card


- It is desired to test whether the average weight of men taller than 175 cm is 75 kg. Which of the following is the H0 hypothesis in this test? (Note: Take into account the rest of the span class-math tex fe span text that can be seen on the pages. a) μ = 75 b) μ= 75 Is not equal c) μ = 175 d) μ = 175 e) μ = 175 Is not equalarrow_forwardBrown wants to conduct an assessment of where employees live and how employees work. Brown wanted to know if where you lived was related to how you worked. What hypothesis tests can be used in this case?arrow_forwardThe USDA limit for salmonella contamination for chicken is 20%. A meat inspector reportsthat the chicken produced by a company exceeds the USDA limit. You perform a hypothesis testto determine whether the meat inspector’s claim is true.When will a type I error occur? Explain using the above contextarrow_forward
- State whether each hypothesis is null or alternative. 1. The average iricome of families per month in a certain town is 38,000 pesos. 2. The proportion of husbands using motorcycles in region 2 is more than 50%. 3. The proportion of patients with lung cancer is higher among smokers than among nonsmokers.arrow_forwardPLEASE HELP WITH THE PROBLEM BELOW Let pm and pf be the respective proportions of male and female white-crowned sparrows that return to their hatching site. We observed that 124 out of 894 males and 70 out of 700 females returned. Does your result agree that there is no difference between the proportions of male and female white-crowned sparrows that return to their hatching site with α = 0.05? Formulate the hypotheses Finish the hypothesis testing and draw your conclusion (use p-value to test the hypotheses)arrow_forwardtest the hypothesis by using the given information.arrow_forward
- Imagine we are taking measurements from the height of mature shrubs. We are interested in seeing whether the shrubs we observe in a particular region differ from those we have observed elsewhere, which we measured as having a median height of 1.65 m. We measure 100 plants and identify that 21 have a height less than 1.65 m (a) What are the hypotheses I would use to test whether the typical height in the region of interest is different to the broader population? (b) If H0 is true, what is the sampling distribution of the number of trees smaller than 1.65 m? (c) Construct a 95% CI for the proportion smaller than the median. (d) Determine the p-value for the same hypotheses, and use this to do a hypothesis test with α = 0.05.arrow_forwardBjork Larsen was trying to decide whether to use a new racing wax for cross-country skis. He decided that the wax would be worth the price if he could average less than 55 seconds on a course he knew well, so he planned to test the wax by racing on the course 8 times. His 8 race times were: 56.3, 65.9, 50.5, 52.4, 46.5, 57.8, 52.5, 43.2 Should he buy the wax? Perform an appropriate hypothesis test and state your conclusion, in context.arrow_forwardA die is specially built so that the even numbers are twice as likely as the odd numbers. A test is made to roll the die 180 times. The results of the occurrence of each face is recorded as the following: Face 1 2 3 4 5 6 Frequency 23 36 22 44 18 37 Is the die made up to the specification? Do a goodness-of-fit test at 10% significance level?arrow_forward
- 3. Washers used in a certain application aresupposed to have a thickness of 2 mm. A qualitycontrol engineer measures the thicknesses for asample of washers and tests H0 ? = 2 versusH1: ? ≠ 2.a. Explain what a Type 1 error would mean, incontext.b. Explain what a Type 2 error would mean, incontext.c. Explain both types of correct decisions in context.arrow_forwardA meteorologist stated that the average temperature during July in Chattanooga was 80 degrees. A sample of July temperatures over a 32-year period was taken. The correct set of hypotheses isarrow_forwardMaria has two routes, E and W, she can take when commuting to work. Both routes go through a railroad crossing, and sometimes she needs to stop at the crossing to allow trains to pass. She claims that the proportion of times she needs to stop when taking route E is different from the proportion of times she needs to stop when taking route W. She conducted the following hypothesis test at the significance level of α=0.10. H0:pE=pWHa:pE≠pW In the hypotheses, pE represents the proportion of times she needs to stop at the crossing when using route E, and pWrepresents the proportion of times she needs to stop at the crossing when using route W. All conditions for inference were met, and the resulting p-value was 0.37. Which of the following is the correct decision for the test? The p-value is less than α, and the null hypothesis is rejected. There is convincing evidence to support the claim that the proportion of times she needs to stop at the crossing is different for the…arrow_forward
 Elementary Geometry For College Students, 7eGeometryISBN:9781337614085Author:Alexander, Daniel C.; Koeberlein, Geralyn M.Publisher:Cengage,