
Concept explainers
Videos
Using Probability Distributions [LO3] Suppose the returns on long-term corporate bonds and T-bills are
a. What is the probability that in any given year, the return on long-term corporate bonds will be greater than 10 percent? Less than 0 percent?
b. What is the probability that in any given year, the return on T-bills will be greater than 10 percent? Less than 0 percent?
c. In 1979, the return on long-term corporate bonds was −2.76 percent. How likely is it that such a low return will recur at some point in the future? T-bills had a return of 10.56 percent in this same year. How likely is it that such a high return on T-bills will recur at some point in the future?
a)
To determine: The probability of earning more than 10 percent on long-term corporate bonds.
Introduction:
The Normal distribution curve is a bell-shaped curve formed based on the frequency distribution of the observations The mean or average of the observations and their standard deviation define the normal distribution curve.
Standard deviation refers to the variation in the actual observations from the average. Z-Score helps to know how many numbers of standard deviations is the raw score or outcome away from the average or mean.
Answer to Problem 24QP
The probability of earning more than 10 percent on long-term corporate bonds is 32.98 percent.
Explanation of Solution
Given information:
Assume that the returns of long-term corporate bonds have a normal distribution. The average return or mean of long-term corporate bonds is 6.3 percent, and the standard deviation is 8.4 percent (Refer to Figure 12.10 in the text).
Determine the probability of having a return greater than 10 percent on long-term government bonds:
Follow the common steps from Step 1 to Step 3 given below. Next, proceed with the Step 4.
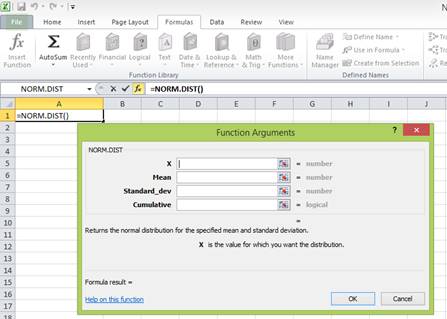
The common steps to be followed to use the “NORM.DIST” function in Excel:
Step 1:
Open an Excel worksheet.
Step 2:
Place the cursor in cell A1.

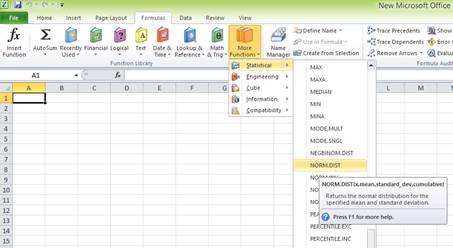
Step 3:
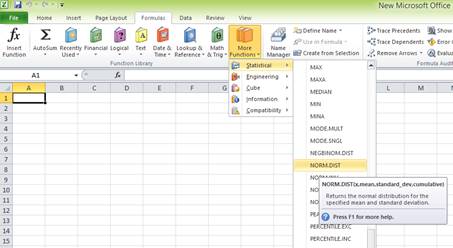
Select the “Formulas” tab, and go to “More functions” in the ribbon. Under “More functions”, select “Statistical”. Under the drop-down menu of “Statistical”, select “NORM.DIST” function.

After clicking the “NORM.DIST” function, a popup window named “Function arguments” appears.
Step 4:
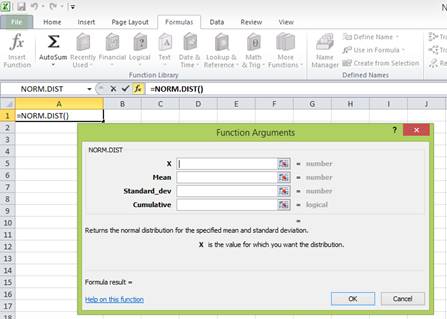
Enter the values. “X” represents the raw score or outcome. Here, it is necessary to test the probability of having more than 10 percent returns. Hence, “X” equals 10 percent. The mean or average return is 6.3 percent. The standard deviation is 8.4 percent. The cumulative distribution function provides the probability of the area to the left of Z. Hence, enter “TRUE” in the “Cumulative” column.
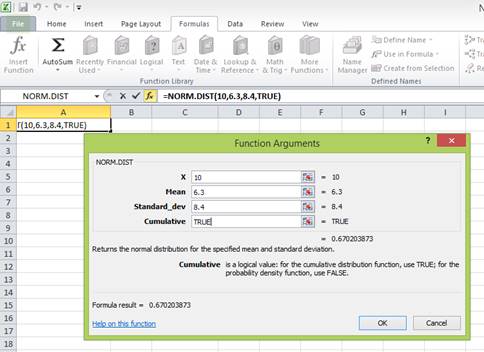
Press “OK” after providing the inputs. The probability of the area to the left of Z is as follows:
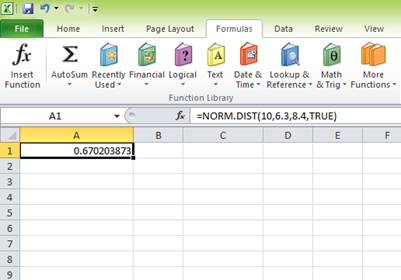
The probability of 0.670203873 represents the area to the left of Z. The area to the left of Z is the probability of getting less than 10 percent return. The area to the right of Z is the probability of getting a return of 10 percent or more.
The total area represented by the normal distribution curve has a probability of “1”. The area to the left of Z has a probability of 0.670203873. Hence, the probability of the area to the right of Z is “1” minus the probability of the area to the left of Z. Hence, the probability of getting 10 percent return or more is 0.329796127 or 32.98 percent
To determine: The probability of earning less than 0 percent on long-term corporate bonds.
Answer to Problem 24QP
The probability of earning less than 0 percent on long-term corporate bonds is 0.226627352 or 22.66 percent.
Explanation of Solution
Given information:
Assume that the returns of long-term corporate bonds have a normal distribution. The average return or mean of long-term corporate bonds is 6.3 percent, and the standard deviation is 8.4 percent (Refer to Figure 12.10 in the text).
Determine the probability of having a return less than 0 percent on long-term government bonds:
Follow the common steps from Step 1 to Step 3 given below. Next, proceed with the Step 4.
The common steps to be followed to use the “NORM.DIST” function in Excel:
Step 1:
Open an Excel worksheet.
Step 2:
Place the cursor in cell A1.

Step 3:
Select the “Formulas” tab, and go to “More functions” in the ribbon. Under “More functions”, select “Statistical”. Under the drop-down menu of “Statistical”, select “NORM.DIST” function.
After clicking the “NORM.DIST” function, a popup window named “Function arguments” appears.

Step 4:
Enter the values. “X” represents the raw score or outcome. Here, it is necessary to test the probability of having (0 percent) return or less. Hence, “X” equals (0 percent). The mean or average return is 6.3 percent. The standard deviation is 8.4 percent. The cumulative distribution function provides the probability of the area to the left of Z. Hence, enter “TRUE” in the “Cumulative” column.
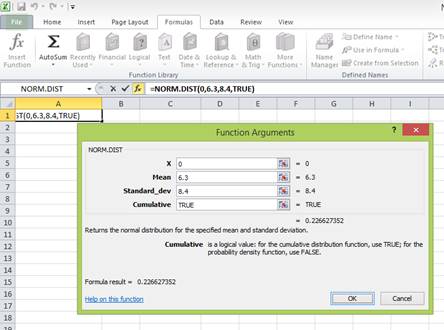
Press “OK” after providing the inputs. The probability of the area to the left of Z is as follows:
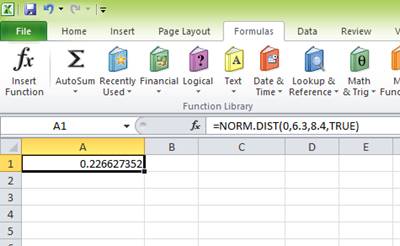
The probability of 0.226627352 represents the area to the left of Z. The area to the left of Z refers to the probability of getting (0 percent) return or less because the left-hand side of the normal distribution curve indicates negative returns. Hence, the probability of earning less than 0 percent is 0.226627352 or 22.66 percent.
b)
To determine: The probability of earning more than 10 percent on Treasury bills.
Answer to Problem 24QP
The probability of earning more than 10 percent on Treasury bills is 0.018006785 or 1.80 percent.
Explanation of Solution
Given information:
Assume that the returns of Treasury bills have a normal distribution. The average return or mean of Treasury bills is 3.5 percent, and the standard deviation is 3.1 percent (Refer to Figure 12.10 in the text).
Determine the probability of having a return greater than 10 percent on Treasury bills:
Follow the common steps from Step 1 to Step 3 given below. Next, proceed with the Step 4.
The common steps to be followed to use the “NORM.DIST” function in Excel:
Step 1:
Open an Excel worksheet.
Step 2:
Place the cursor in cell A1.

Step 3:
Select the “Formulas” tab, and go to “More functions” in the ribbon. Under “More functions”, select “Statistical”. Under the drop-down menu of “Statistical”, select “NORM.DIST” function.
After clicking the “NORM.DIST” function, a popup window named “Function arguments” appears.
Step 4:
Enter the values. “X” represents the raw score or outcome. Here, it is necessary to test the probability of having more than 10 percent returns. Hence, “X” equals 10 percent. The mean or average return is 3.5 percent. The standard deviation is 3.1 percent. The cumulative distribution function provides the probability of the area to the left of Z. Hence, enter “TRUE” in the “Cumulative” column.
Press “OK” after providing the inputs. The probability of the area to the left of Z is as follows:
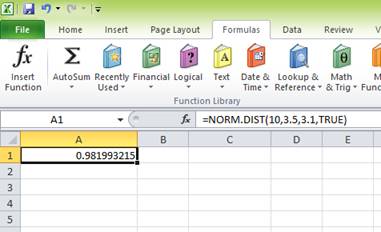
The probability of 0.981993215 represents the area to the left of Z. The area to the left of Z is the probability of getting less than 10 percent return. The area to the right of Z is the probability of getting a return of 10 percent or more.
The total area represented by the normal distribution curve has a probability of “1”. The area to the left of Z has a probability of 0.981993215. Hence, the probability of the area to the right of Z is “1” minus the probability of the area to the left of Z. Hence, the probability of getting 10 percent return or more is 0.018006785 or 1.80 percent
To determine: The probability of earning less than 0 percent on Treasury bills.
Answer to Problem 24QP
The probability of earning less than 0 percent on Treasury bills is 0.129442113 or 12.94 percent.
Explanation of Solution
Given information:
Assume that the returns of Treasury bills have a normal distribution. The average return or mean of Treasury bills is 3.5 percent, and the standard deviation is 3.1 percent (Refer to Figure 12.10 in the text).
Determine the probability of having a return less than 0 percent on Treasury bills:
Follow the common steps from Step 1 to Step 3 given below. Next, proceed with the Step 4.
The common steps to be followed to use the “NORM.DIST” function in Excel:
Step 1:
Open an Excel worksheet.
Step 2:
Place the cursor in cell A1.

Step 3:
Select the “Formulas” tab, and go to “More functions” in the ribbon. Under “More functions”, select “Statistical”. Under the drop-down menu of “Statistical”, select “NORM.DIST” function.
After clicking the “NORM.DIST” function, a popup window named “Function arguments” appears.
Step 4:
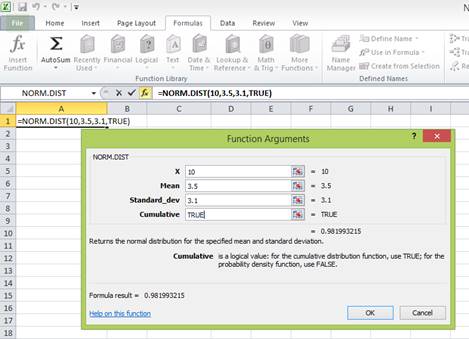
Enter the values. “X” represents the raw score or outcome. Here, it is necessary to test the probability of having (0 percent) return or less. Hence, “X” equals (0 percent). The mean or average return is 3.5 percent. The standard deviation is 3.1 percent. The cumulative distribution function provides the probability of the area to the left of Z. Hence, enter “TRUE” in the “Cumulative” column.
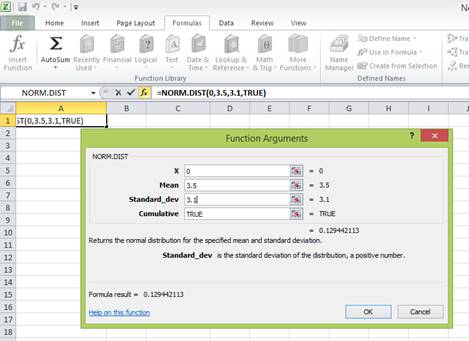
Press “OK” after providing the inputs. The probability of the area to the left of Z is as follows:
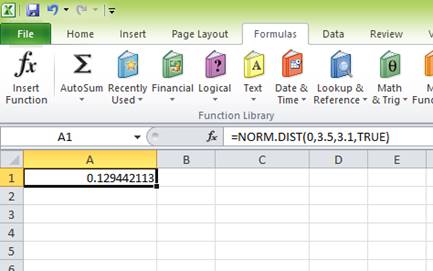
The probability of 0.129442113 represents the area to the left of Z. The area to the left of Z refers to the probability of getting (0 percent) return or less because the left-hand side of the normal distribution curve indicates negative returns. Hence, the probability of earning less than 0 percent is 0.129442113 or 12.94 percent.
c)
To determine: The probability of earning (2.76 percent) on long-term corporate bonds.
Answer to Problem 24QP
The probability of earning (2.76 percent) on long-term corporate bonds is 0.140389412 or 14.04 percent.
Explanation of Solution
Given information:
Assume that the returns of long-term corporate bonds have a normal distribution. The average return or mean of long-term corporate bonds is 6.3 percent, and the standard deviation is 8.4 percent (Refer to Figure 12.10 in the text).
Determine the probability of having (2.76 percent) on long-term government bonds:
Follow the common steps from Step 1 to Step 3 given below. Next, proceed with the Step 4.
The common steps to be followed to use the “NORM.DIST” function in Excel:
Step 1:
Open an Excel worksheet.
Step 2:
Place the cursor in cell A1.
Step 3:
Select the “Formulas” tab, and go to “More functions” in the ribbon. Under “More functions”, select “Statistical”. Under the drop-down menu of “Statistical”, select “NORM.DIST” function.
After clicking the “NORM.DIST” function, a popup window named “Function arguments” appears.
Step 4:
Enter the values. “X” represents the raw score or outcome. Here, it is necessary to test the probability of having (2.76 percent) return or less. Hence, “X” equals (2.76 percent). The mean or average return is 6.3 percent. The standard deviation is 8.4 percent. The cumulative distribution function provides the probability of the area to the left of Z. Hence, enter “TRUE” in the “Cumulative” column.
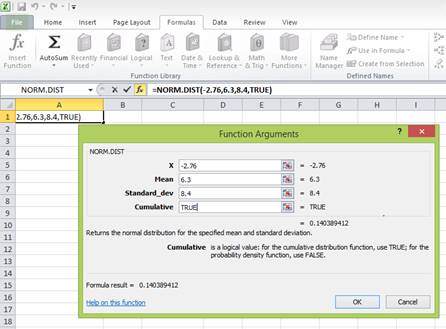
Press “OK” after providing the inputs. The probability of the area to the left of Z is as follows:
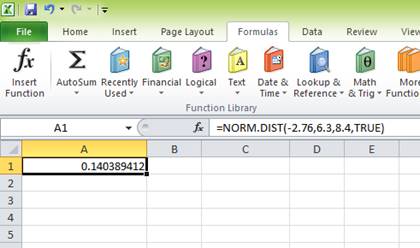
The probability of 0.140389412 represents the area to the left of Z. The area to the left of Z refers to the probability of getting (2.76 percent) return or less because the left-hand side of the normal distribution curve indicates negative returns. Hence, the probability of earning (2.76 percent) is 0.140389412 or 14.04 percent.
To determine: The probability of earning 10.56 percent on Treasury bills.
Answer to Problem 24QP
The probability of earning 10.56 percent on Treasury bills is 0.011380598 or 1.14 percent.
Explanation of Solution
Given information:
Assume that the returns of Treasury bills have a normal distribution. The average return or mean of Treasury bills is 3.5 percent, and the standard deviation is 3.1 percent (Refer to Figure 12.10 in the text).
Determine the probability of having a return of 10.56 percent on Treasury bills:
Follow the common steps from Step 1 to Step 3 given below. Next, proceed with the Step 4.
The common steps to be followed to use the “NORM.DIST” function in Excel:
Step 1:
Open an Excel worksheet.
Step 2:
Place the cursor in cell A1.

Step 3:
Select the “Formulas” tab, and go to “More functions” in the ribbon. Under “More functions”, select “Statistical”. Under the drop-down menu of “Statistical”, select “NORM.DIST” function.
After clicking the “NORM.DIST” function, a popup window named “Function arguments” appears.
Step 4:
Enter the values. “X” represents the raw score or outcome. Here, it is necessary to test the probability of having 10.56 percent returns. Hence, “X” equals 10.56 percent. The mean or average return is 3.5 percent. The standard deviation is 3.1 percent. The cumulative distribution function provides the probability of the area to the left of Z. Hence, enter “TRUE” in the “Cumulative” column.
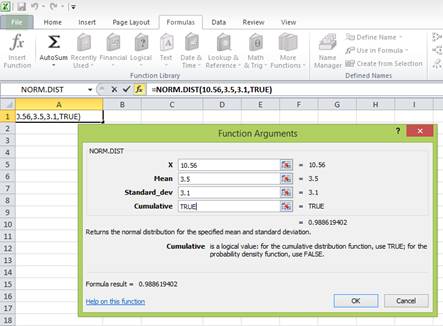
Press “OK” after providing the inputs. The probability of the area to the left of Z is as follows:

The probability of 0.988619402 represents the area to the left of Z. The area to the left of Z is the probability of getting less than 10.56 percent return. The area to the right of Z is the probability of getting a return of 10.56 percent or more.
The total area represented by the normal distribution curve has a probability of “1”. The area to the left of Z has a probability of 0.988619402. Hence, the probability of the area to the right of Z is “1” minus the probability of the area to the left of Z. Hence, the probability of getting 10.56 percent return or more is 0.011380598 or 1.14 percent
Want to see more full solutions like this?
Chapter 12 Solutions
Connect 1 Semester Access Card for Fundamentals of Corporate Finance


- Question 6 Suppose that the consensus forecast of security analysts of your favorite company is that earnings next year will be $5.00 per share. The company plows back 50% of its earnings and if the Chief Financial Officer (CFO) estimates that the company's return on equity (ROE) is 16%. Assuming the plowback ratio and the ROE are expected to remain constant forever: Suppose that you are confident that 10% is the required rate of return on the stock. What does the market price of $50.00 per share imply about the market’s estimate of the company’s expected return on equity? (please give a number)arrow_forwardConsider the following scenario analysis: Scenario Probability Stocks Bonds Recession 0.30 -6 % +15% Normal Economy 0.30 +14 + 7 Boom 0.40 +26 +5 Calculate the expected rate of return and standard deviation for each investment? Which investment would you prefer?arrow_forwardQ6. You would like to invest in two shares A and B. The return on these shares over the next year depends on the state of economy, which will be described as “Boom”, “Normal”, “Slow” and “Recession”. The table below shows the probability of each of these states of economy, and the expected return on each share given each possible state of the economy. The correlation coefficient between shares A and B is 0.5. State of the economy Probability A Return B Return Boom 0.20 0.25 0.21 Normal 0.40 0.16 0.12 Slow 0.25 0.10 0.08 Recession 0.15 - 0.06 0.05 What is the expected return on A and B shares? What is the standard deviation of A and B shares? What is the expected return on portfolio comprised of 55% invested in share A and the balance in share B? What is the standard deviation on portfolio comprised of 55% invested in share A and 45% invested in share B?arrow_forward
- QUESTION 5 A bank has estimated its VAR for its bond portfolio is $25,600 and for its stock portfolio, it is $33,600. The correlation coefficient between the two portfolios is -0.25. How much VAR would be reduced if they were allowed to aggregate the VAR of the two portfolios? $36,800.00 $59,200.00 $10,400.00 $22,400.00arrow_forwardFinance 6. Bozo finds the following information online: the 10-year US treasury note is yielding 3.8%, and the beta of the stock he is following, Clown Co. (CC) is 2.0. The required return for CC is 18%. What is the expected return of the market? If the Federal Reserve raises the 10-year notes to 4.5%, what would the new expected return be for CC?arrow_forward12.2 Factor Models Suppose a three-factor model is appropriate to describe the returns of a stock. Information about those three factors is presented in the following chart: Factor Beta Expected Value Actual Value GDP .0000734 $19,571 $19,843 Inflation -.90 2.6% 2.7% Interest Rates -.32 3.4% 3.2% What is the systematic risk of the stock return? Suppose unexpected bad news about the firm was announced that causes the stock price to drop by .85 percent. If the expected return on the stock is 10.9 percent, what is the total return on…arrow_forward
- Consider the following scenario analysis: Rate of Return Scenario Probability Stocks Bonds Recession 0.30 −5 % 18 % Normal economy 0.60 19 % 7 % Boom 0.10 24 % 7 % b. Calculate the expected rate of return and standard deviation for each investment.arrow_forwardSuppose the rate of return on short-term government securities (perceived to be risk-free) is about 5%. Suppose also that the expected rate of return required by the market for a portfolio with a beta of 1 is 12%. According to the capital asset pricing model:a. What is the expected rate of return on the market portfolio?b. What would be the expected rate of return on a stock with β = 0?c. Suppose you consider buying a share of stock at $40. The stock is expected to pay $3 dividends next year and you expect it to sell then for $41. The stock risk has been evaluated at β = −.5. Is the stock overpriced or underpriced?arrow_forward1) Consider the following expectations for the market and two stocks in two possible equally likely states: State Market return Stock A Stock B Boom 25% 38% 12% Recession 5% -2% 6% a. What is the expected return on each stock? b. Given that the risk-free rate is 6%, draw the Security Market Line (SML) for this economy, and plot the two securities on the graph given that you have computed Stock A has a β of 2 and Stock B has a β of 0.3. c. Assuming that the CAPM holds, state for each of the two stocks if the stock is overvalued, correctly priced, or undervalued according to CAPM?arrow_forward
- Using the CAPM theory, if the Volatility of a stock is twice as great as the market, the market return on stocks in general (using the S&P 500 as a proxy) is 12 %, and treasury bills are yielding 2%, what is the return that investors in that security can expect? 12% 16% 20% 22%arrow_forwardConsider the following scenario analysis: Rate of Return Scenario Probability Stocks Bonds Recession 0.30 −8 % 21 % Normal economy 0.50 22 % 9 % Boom 0.20 32 % 9 % a. Is it reasonable to assume that Treasury bonds will provide higher returns in recessions than in booms? No Yes b. Calculate the expected rate of return and standard deviation for each investment. (Do not round intermediate calculations. Enter your answers as a percent rounded to 1 decimal place.) c. Which investment would you prefer?arrow_forwardAssume that the dividend payout ratio will be 55 percent when the rate on long-term government bonds falls to 9 percent. Because investors are becoming more risk averse, the equity risk premium will rise to 8 percent and investors will require a 7 percent return. The return on equity will be 13 percent. What is your expectation of the market P/E ratio?arrow_forward
 Essentials Of InvestmentsFinanceISBN:9781260013924Author:Bodie, Zvi, Kane, Alex, MARCUS, Alan J.Publisher:Mcgraw-hill Education,

 Foundations Of FinanceFinanceISBN:9780134897264Author:KEOWN, Arthur J., Martin, John D., PETTY, J. WilliamPublisher:Pearson,
 Fundamentals of Financial Management (MindTap Cou...FinanceISBN:9781337395250Author:Eugene F. Brigham, Joel F. HoustonPublisher:Cengage Learning
 Corporate Finance (The Mcgraw-hill/Irwin Series i...FinanceISBN:9780077861759Author:Stephen A. Ross Franco Modigliani Professor of Financial Economics Professor, Randolph W Westerfield Robert R. Dockson Deans Chair in Bus. Admin., Jeffrey Jaffe, Bradford D Jordan ProfessorPublisher:McGraw-Hill Education