
UPENN: LOOSE LEAF CORP.FIN W/CONNECT
17th Edition
ISBN: 9781260361278
Author: Ross
Publisher: McGraw-Hill Publishing Co.
expand_more
expand_more
format_list_bulleted
Concept explainers
Videos
Textbook Question
Chapter 12, Problem 2QP
Factor Models Suppose a three-factor model is appropriate to describe the returns of a stock. Information about those three factors is presented in the following chart:
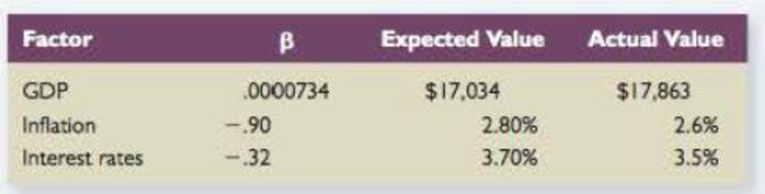
- a. What is the systematic risk of the stock return?
- b. Suppose unexpected bad news about the firm was announced that causes the stock price to drop by 1.1 percent If the expected return on the stock is 11.7 percent, what is the total return on this stock?
Expert Solution & Answer
Want to see the full answer?
Check out a sample textbook solution
Students have asked these similar questions
You are comparing Stock A to Stock B. Given the following information, what is the difference in the expected returns of these two securities?
State of Economy
Probability of State of Economy
Rate of Return if State Occurs
Stock A
Stock B
Normal
.75
.13
.16
Recession
.25
−.05
−.21
Over time, the unexpected return on a company's stock is expected to equal
Multiple Choice
the company's average rate of return.
the average return on the overall market.
zero,
the risk-free rate.
the market risk premium.
1) what is the expected return rate for stock A
2) what is the expected return rate for stock B
3) what is the standard deviation of returns for stock A
4) what is the standard deviation of returns for stock B.
Chapter 12 Solutions
UPENN: LOOSE LEAF CORP.FIN W/CONNECT
Ch. 12 - Prob. 1CQCh. 12 - Prob. 2CQCh. 12 - Prob. 3CQCh. 12 - Prob. 4CQCh. 12 - Market Model versus APT What are the differences...Ch. 12 - APT In contrast to the CAPM, the APT does not...Ch. 12 - CAPM versus APT What is the relationship between...Ch. 12 - Prob. 8CQCh. 12 - Data Mining What is data mining? Why might it...Ch. 12 - Prob. 10CQ
Ch. 12 - Prob. 1QPCh. 12 - Factor Models Suppose a three-factor model is...Ch. 12 - Prob. 3QPCh. 12 - Multifactor Models Suppose stock returns can be...Ch. 12 - Prob. 5QPCh. 12 - Market Model The following three stocks are...Ch. 12 - Prob. 7QPCh. 12 - Prob. 8QPCh. 12 - APT Assume that the following market model...Ch. 12 - Prob. 10QP
Knowledge Booster


Learn more about
Need a deep-dive on the concept behind this application? Look no further. Learn more about this topic, finance and related others by exploring similar questions and additional content below.Similar questions
- Q3) Consider the following two companies and their forecasted returns for the upcoming year: (picture) A. What is the standard deviation of the returns on each company's stock (Company A, and B) (write all formulas). B. Of these two stocks, which is riskier? Justify your answerarrow_forwardThe metric that is used to show the extent to which a given stock’s return move up and down with the stock market? a. Correlation b. Beta c. Standard deviation d. Expected returnarrow_forwardThe additional return over the risk-free rate needed to compensate investors for assuming an average amount of risk. a. Market Risk Premium b. Risk-free rate С. Stock's beta O d. Security Market Line e. Required Return on Stockarrow_forward
- A stock’s return has the following distribution: Demand for the company’s products Probability of this demand occurring Rate of Return if this demand occurs Weak 0.1 (0.5) Below Average 0.2 (0.05) Average 0.4 0.16 Above Average 0.2 0.25 Strong 0.1 0.60 Use statistical measures to calculate the risk and return of the stock.arrow_forward1. Calculate the Expected Return, Standard Deviation, and Beta for each stock. 2. Which stock has more systematic risk and which one has more unsystematic risk? Which stock is "riskier"? Explain your answer completely. Use excel to show formulas and calculationsarrow_forwardQ.Which of the following statements are true/false: I: The implied volatility of a stock can be calculated by deternining the standard deviation of stock returns over the last one year. II: The implied volatility of a stock can be calculated by deternining the standard deviation of stock returns over the last six months. A. I is true, II is false B. I is false, II is true C. I and II are both false D. I and II are both truearrow_forward
- Which of the following will (holding everything else constant) cause the price earnings (P/E) ratio of a stock to decrease: The required return increases The risk-free rate decreases The stock's beta decreases The required return decreasesarrow_forwardIf a stock's expected return plots on or above the SML, then the stock's return is SML, the stock's return is to compensate the investor for risk. cent to compensate the investor for risk. If a stock's expected return plots below the The SML line can change due to expected Inflation and risk aversion. If inflation changes, then the SML plotted on a graph will shift up or down parallel to the old SML. If risk aversion changes, then the SML plotted on a graph will rotate up or down becoming more or less steep if investors become more or less risk averse. A firm can influence market risk (hence its beta coefficient) through changes in the composition of its assets and through changes in the amount of debt it uses. Quantitative Problem: You are given the following information for Wine and Cork Enterprises (WCE): Tar 4%; 10 % ; RPM 6%, and beta - 1.1 What is WCE's required rate of return? Do not round intermediate calculations. Round your answer to two decimal places. -75 % If inflation…arrow_forwardThe following table represents the rate of returns of two stocks in different economic conditions along with their probabilities (the data are also uploaded on moodle) RATES OF RETURN ON STOCKS EXPECTED ECONOMIC PROBABILITY STOCK A STOCK B CONDITIONS RECESSION 0.55 -0.04 -0.02 STABLE 0.35 0.25 0.30 EXPANDING 0.10 0.15 0.20 Answer the following by using mathematical calculations: a) Calculate the expected rate of return for each stock respectively. Explain what the expected value implies. b) Calculate the standard deviation for each stock respectively. Explain what the standard deviation implies. c) If you were an investor in which stock you were going to invest? Justify your answer. d) Calculate the covariance between Stock A and stock B. Discuss. e) Calculate the expected return and the standard deviation of the portfolio consisting 40% in stock A and 60% in stock B. f) Discuss the risk and return associated with investing i All of your funds in stock A ii. All of your funds in stock…arrow_forward
- b. Consider the following information about three stocks: Probability of State of i. ii. iii. iv. State of Economy V. Boom Recession Economy 0.40 0.60 From the information given, you are required to answer the following questions. Compute the Standard Deviation for each stock. Compute the Coefficient Variation for each stock. Based on your computation in part (i) and (ii), which stock is riskier? Explain your answer. Rate of Return if State Occurs Stock Hang Stock Hang Jebat 7% 13% Tuah 28% (5%) Stock Hang Kasturi 15% 3% Assume that you have RM14,000 invested in Stock Hang Jebat whose beta is 1.5, RM19,000 invested in Stock Hang Kasturi whose beta is 2.5 and RM17,000 invested in Stock Hang Tuah whose beta is 1.6. Determine what is the beta of this portfolio. Based on your answer in part (iv), compute the required rate of return for this portfolio, given that the market rate of return is 13% and risk-free rate is 5%.arrow_forwardPlease do both questions QUESTION 1 Assume the following data for a stock: beta = 0.9; risk-free rate = 4 percent; market rate of return = 24 percent; and expected rate of return on the stock = 23 percent. Then the stock is: correctly priced. overpriced. this is the wrong answer underpriced. The answer cannot be determined. QUESTION 2 Assume the following data for a stock: beta = 1.5; risk-free rate = 8 percent; market rate of return = 18 percent; and expected rate of return on the stock = 22 percent. Then the stock is: overpriced. underpriced. this is the wrong answer correctly priced. cannot be determinedarrow_forwardLet Ps be the current market price of a share of common stock of Company X. Let P; be the "fundamental" value of a share of common stock of Company X. Let r be the long-run average annual compounded rate of return on common stocks, ånd b be the long-run annual compounded rate of return on corporate bonds. Finally, let ɛ be a random error term. Which of the following equations best characterizes the Efficient Markets Hypothesis? Select one: O a. Ps = Pf + r+ ɛ O b. Ps = Pf + ɛ- b O c. Ps = (Pf + ɛ) x (r – b) O d. Ps = Pf + ɛarrow_forward
arrow_back_ios
SEE MORE QUESTIONS
arrow_forward_ios
Recommended textbooks for you
 Essentials Of InvestmentsFinanceISBN:9781260013924Author:Bodie, Zvi, Kane, Alex, MARCUS, Alan J.Publisher:Mcgraw-hill Education,

 Foundations Of FinanceFinanceISBN:9780134897264Author:KEOWN, Arthur J., Martin, John D., PETTY, J. WilliamPublisher:Pearson,
 Fundamentals of Financial Management (MindTap Cou...FinanceISBN:9781337395250Author:Eugene F. Brigham, Joel F. HoustonPublisher:Cengage Learning
 Corporate Finance (The Mcgraw-hill/Irwin Series i...FinanceISBN:9780077861759Author:Stephen A. Ross Franco Modigliani Professor of Financial Economics Professor, Randolph W Westerfield Robert R. Dockson Deans Chair in Bus. Admin., Jeffrey Jaffe, Bradford D Jordan ProfessorPublisher:McGraw-Hill Education
Essentials Of Investments
Finance
ISBN:9781260013924
Author:Bodie, Zvi, Kane, Alex, MARCUS, Alan J.
Publisher:Mcgraw-hill Education,
Foundations Of Finance
Finance
ISBN:9780134897264
Author:KEOWN, Arthur J., Martin, John D., PETTY, J. William
Publisher:Pearson,
Fundamentals of Financial Management (MindTap Cou...
Finance
ISBN:9781337395250
Author:Eugene F. Brigham, Joel F. Houston
Publisher:Cengage Learning
Corporate Finance (The Mcgraw-hill/Irwin Series i...
Finance
ISBN:9780077861759
Author:Stephen A. Ross Franco Modigliani Professor of Financial Economics Professor, Randolph W Westerfield Robert R. Dockson Deans Chair in Bus. Admin., Jeffrey Jaffe, Bradford D Jordan Professor
Publisher:McGraw-Hill Education
Portfolio return, variance, standard deviation; Author: MyFinanceTeacher;https://www.youtube.com/watch?v=RWT0kx36vZE;License: Standard YouTube License, CC-BY