
Videos
Application Exercises
In the year after warning labels were put on cigarette pack, the number of smokers dropped from approximately two in five adults to one in five. The bar graph shows the percentage of American adults who smoked cigarettes for selected years from 1970. Through 2010.
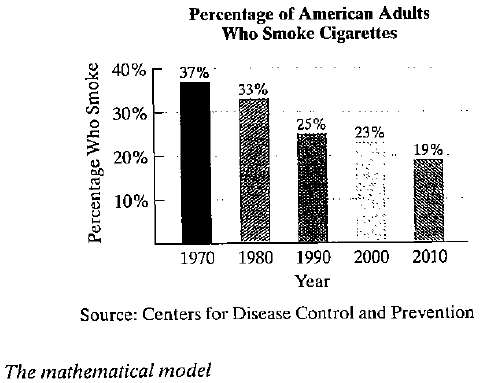
The Mathematical model
describes the percentage of Americans who smoked cigarettes, p, x years after 1970. Use this model to solve Exercises 97–98.
a. Does the mathematical model underestimate or overestimate the percentage of American adults who smoked cigarettes in 2010? By how much?
b. Use the mathematical model to project the year when only 7% of American adults will smoke cigarettes.
Want to see the full answer?
Check out a sample textbook solution
Chapter 1 Solutions
Oxnard College College Algebra Package
Additional Math Textbook Solutions
Beginning and Intermediate Algebra
College Algebra Essentials
Elementary & Intermediate Algebra
Elementary Algebra For College Students (10th Edition)
Elementary Algebra: Concepts and Applications (10th Edition)


- In Pennsylvania, the state income tax is directly proportional to gross income. You work in Pennsylvania and your state income tax deduction is $46.05 for a gross monthly income of $1500. Find a mathematical model that gives the Pennsylvania state income tax in terms of gross income.arrow_forwardQ3. A person’s credit score is important in determining the interest rate they have to pay on a home mortgage. According to Consumer Credit Counseling Service, a homeowner with a $100,000 mortgage and a 580 credit score will pay $90,325 more in interest charges over the life of a 30-year loan than a homeowner with the same mortgage and a credit score of 720. How much higher would the interest rate per year have to be in order to account for this much difference in interest charges, if the $100,000 loan is repaid in a single lump sum payment at the end of 30 years?arrow_forwardNUMBER 2, PART 2arrow_forward
- Using data and projections from 1980 through 2050, the number (in millions) of people in a census category of a population is given by y=0.834x+6.015,where x is the number of years after 1980. During what year was the number of people in this category 11 million, if this model is accurate? The year in which the population numbered 11 million was _____.arrow_forwardCollege students are graduating with the highest debt burden in history. The bar graph shows the mean, or average, student-loan debt in the United States for five selected graduating years from 2001 through 2013. Here are two mathematical models for the data shown by the graph. In each formula, D represents mean student-loan debt, in dollars, x years after 2000. The Model 1 is, D = 1188x + 16,218 and the Model 2 is D = 46x2 + 541x + 17,650. Solve, a. Which model better describes the data for 2001?b. Does the polynomial model of degree 2 underestimate or overestimate the mean student-loan debt for 2013? By how much?arrow_forwardThe number of smart phone subscribers (in millions) between 2005 and 2012 can be modeled by s(x) = 11.25x + 31.75, where x is the number of years after 2005. In what year does the model indicate that there were 81,700,000 subscribers? A) 2007 B) 2009 C) 2010 D) 2008 E) 2011arrow_forward
 Algebra & Trigonometry with Analytic GeometryAlgebraISBN:9781133382119Author:SwokowskiPublisher:Cengage
 Big Ideas Math A Bridge To Success Algebra 1: Stu...AlgebraISBN:9781680331141Author:HOUGHTON MIFFLIN HARCOURTPublisher:Houghton Mifflin Harcourt