
Concept explainers
Videos
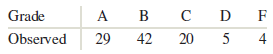
Grade distribution: A statistics teacher claims that, on the average, 20% of her students get a grade of A, 35% get a B, 25% get a C, 10% get a D, and 10% get an F. The grades of a random sample of 100 students were recorded. The following table presents the results.
- How many of the students in the sample got an A? How many got an F?
- Compute the expected frequencies.
- Which grades were given more often than expected? Which grades were given less often than expected?
- What is the value of
- How many degrees of freedom are there?
- Test the hypothesis that the grades follow the distribution claimed by the teacher. Use the 0.05 level of significance.
a.
To calculate: The number of students that got an A and an F.
Explanation of Solution
Given:
The data set is:
| Category | Observed |
| A | 29 |
| B | 42 |
| C | 20 |
| D | 5 |
| F | 4 |
From the provided table, it is clear that there are 29 students that got an A and 4 students got an F.
b.
To calculate: The expected frequencies.
Explanation of Solution
The formula to calculate the expected frequency is:
Here, n can be calculated as:
Thus, the expected frequencies can be calculated as:
c.
To find: The grades that were given more often and less often than expected.
Explanation of Solution
By comparing the expected frequencies with observed frequencies it is clear that A and B grades were given more often than expected. While, C and D grades were given less often.
d.
To find: The value of
Answer to Problem 22E
The required value is 12.55.
Explanation of Solution
The provided data can be calculated as:
| Category |
|
|
|
|
|
| A | 29 | 20 | 9 | 81 | 4.05 |
| B | 42 | 35 | 7 | 49 | 1.4 |
| C | 20 | 25 | -5 | 25 | 1 |
| D | 5 | 10 | -5 | 25 | 2.5 |
| F | 4 | 10 | -6 | 36 | 3.6 |
Thus, the value of chi-square
e.
To find: The degree of freedom.
Answer to Problem 22E
The degree of freedom is 4.
Explanation of Solution
Number of categories are 5.
The degree of freedom can be calculated as:
f.
To check: Whether the grades are same as suggested by teacher by conducting the hypothesis at 5% level of significance.
Explanation of Solution
The null and alternative hypotheses are:
The critical value of chi-square at 5% level of significance and 4 degree of freedom is 9.488. And, the calculated value of chi-square is 1.2.55.
Since, the calculated value is greater than the critical chi-square value, the null hypothesis is rejected. Thus, there is insufficient evidence to conclude that grades do not follow the distribution as suggested by the teacher.
Want to see more full solutions like this?
Chapter 12 Solutions
Elementary Statistics ( 3rd International Edition ) Isbn:9781260092561


 MATLAB: An Introduction with ApplicationsStatisticsISBN:9781119256830Author:Amos GilatPublisher:John Wiley & Sons Inc
 Probability and Statistics for Engineering and th...StatisticsISBN:9781305251809Author:Jay L. DevorePublisher:Cengage Learning
 Statistics for The Behavioral Sciences (MindTap C...StatisticsISBN:9781305504912Author:Frederick J Gravetter, Larry B. WallnauPublisher:Cengage Learning
 Elementary Statistics: Picturing the World (7th E...StatisticsISBN:9780134683416Author:Ron Larson, Betsy FarberPublisher:PEARSON
 The Basic Practice of StatisticsStatisticsISBN:9781319042578Author:David S. Moore, William I. Notz, Michael A. FlignerPublisher:W. H. Freeman
 Introduction to the Practice of StatisticsStatisticsISBN:9781319013387Author:David S. Moore, George P. McCabe, Bruce A. CraigPublisher:W. H. Freeman