Mathematical Ideas (13th Edition) - Standalone book
13th Edition
ISBN: 9780321977076
Author: Charles D. Miller, Vern E. Heeren, John Hornsby, Christopher Heeren
Publisher: PEARSON
expand_more
expand_more
format_list_bulleted
Concept explainers
Videos
Question
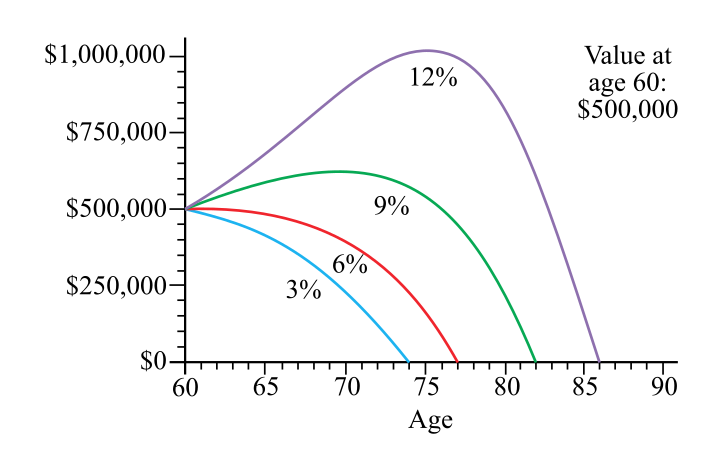
Chapter 12.1, Problem 25E
To determine
The age of Saura when her money runs out after retirement if she can maintain an average annual return of 9 %
Expert Solution & Answer
Want to see the full answer?
Check out a sample textbook solution
Chapter 12 Solutions
Mathematical Ideas (13th Edition) - Standalone book
Ch. 12.1 - In Exercises I and 2, use the given data to do the...Ch. 12.1 - In Exercises 1 and 2, use the given data to do the...Ch. 12.1 - In Exercises 3-6, use the given data to do the...Ch. 12.1 - In Exercises 3-6, use the given data to do the...Ch. 12.1 - In Exercises 3-6, use the given data to do the...Ch. 12.1 - In Exercises 3-6, use the given data to do the...Ch. 12.1 - In each of Exercises 7-10, construct a...Ch. 12.1 - In each of Exercises 7-10, construct a...Ch. 12.1 - In each of Exercises 7-10, construct a...Ch. 12.1 - In each of Exercises 7-10, construct a...
Ch. 12.1 - Federal Revenue and Spending The graph shows U.S....Ch. 12.1 - Federal Revenue and Spending The graph shows U.S....Ch. 12.1 - Federal Revenue and Spending The graph shows U.S....Ch. 12.1 - Federal Revenue and Spending The graph shows U.S....Ch. 12.1 - Prob. 15ECh. 12.1 - Refer to the above graphs for Exercises 16-20....Ch. 12.1 - Prob. 17ECh. 12.1 - Refer to the above graphs for Exercises 16-20....Ch. 12.1 - Prob. 19ECh. 12.1 - Refer to the above graphs for Exercises 16-20....Ch. 12.1 - Reading a Circle Graph of Job-Training Sources The...Ch. 12.1 - Reading a Circle Graph of Job-Training Sources The...Ch. 12.1 - Prob. 23ECh. 12.1 - Correspondence between Education and Earnings Data...Ch. 12.1 - Prob. 25ECh. 12.1 - Net Worth of Retirement Savings Saura, wishing to...Ch. 12.1 - Prob. 27ECh. 12.1 - Net Worth of Retirement Savings Saura, wishing to...Ch. 12.1 - Prob. 29ECh. 12.1 - Sample Masses in a Geology Laboratory...Ch. 12.1 - Sample Masses in a Geology Laboratory...Ch. 12.1 - Record Temperatures According to the National...Ch. 12.1 - Prob. 33ECh. 12.1 - Frequencies and Probabilities of letter Occurrence...Ch. 12.1 - Prob. 35ECh. 12.1 - Prob. 36ECh. 12.1 - 37. Is the probability distribution in Exercise 36...Ch. 12.1 - Prob. 38ECh. 12.1 - Probabilities of Study Times Recall that the...Ch. 12.1 - Favorite Sports among Recreation Students The 40...Ch. 12.1 - Favorite Sports among Recreation Students The 40...Ch. 12.1 - Favorite Sports among Recreation Students The 40...Ch. 12.2 - For each list of data, calculate (a) the mean (to...Ch. 12.2 - For each list of data, calculate (a) the mean (to...Ch. 12.2 - For each list of data, calculate (a), the mean (to...Ch. 12.2 - For each list of data, calculate (a) the mean (to...Ch. 12.2 - For each list of data, calculate (a) the mean (to...Ch. 12.2 - For each list of data, calculate (a) the mean (to...Ch. 12.2 - For each list of data, calculate (a) the mean (to...Ch. 12.2 - For each list of data, calculate (a) the mean (to...Ch. 12.2 - Answer each question. Gymnasts' Scores An Olympic...Ch. 12.2 - Quiz Grades The average of 5 quiz grades is 10....Ch. 12.2 - For each category in Exercises 11-16, find (a) (he...Ch. 12.2 - For each category in Exercises 11-16, find (a) the...Ch. 12.2 - For each category in Exercises 11-16, find (a) the...Ch. 12.2 - For each category in Exercises 11-16, find (a) the...Ch. 12.2 - For each category in Exercises 11-16, find (a) the...Ch. 12.2 - For each category in Exercises 11-16, find (a) the...Ch. 12.2 - Leading U.S. Businesses The table shows the top...Ch. 12.2 - Leading U.S. Businesses The table shows the top...Ch. 12.2 - Measuring Elapsed Times While doing an experiment,...Ch. 12.2 - Measuring Elapsed Times White doing an experiment,...Ch. 12.2 - The student from Exercises 19 and 20,when...Ch. 12.2 - The student from Exercises 19 and 20,when...Ch. 12.2 - The student from Exercises 19 and 20,when...Ch. 12.2 - The student from Exercises 19 and 20, when...Ch. 12.2 - Scores on Management Examinations Thao earned the...Ch. 12.2 - Scores on Management Examinations Thao earned the...Ch. 12.2 - Scores on Management Examinations Thao earned the...Ch. 12.2 - For each of the following frequency distributions,...Ch. 12.2 - Prob. 29ECh. 12.2 - 30. Average Employee Salary A company has
15...Ch. 12.2 - Grade-Point Averages Find the grade-point average...Ch. 12.2 - Grade-Point Averages Find the grade-point average...Ch. 12.2 - Prob. 33ECh. 12.2 - Federal Budget Totals The table gives federal...Ch. 12.2 - Prob. 35ECh. 12.2 - World Cell Phone Use In 2012, just the top six...Ch. 12.2 - Prob. 37ECh. 12.2 - Crew, Passengers, and Hijackers on 3/11 Airliners...Ch. 12.2 - Prob. 39ECh. 12.2 - Olympic Medal Standings The top ten medal-winning...Ch. 12.2 - Prob. 41ECh. 12.2 - Olympic Medal Standings The top ten medal-winning...Ch. 12.2 - Prob. 43ECh. 12.2 - In Exercises 44 and 45, use the given...Ch. 12.2 - Prob. 45ECh. 12.2 - What does your box plot of Exercise 18 for...Ch. 12.2 - Prob. 47ECh. 12.2 - Prob. 48ECh. 12.2 - Prob. 49ECh. 12.2 - Prob. 50ECh. 12.2 - Prob. 51ECh. 12.2 - Prob. 52ECh. 12.2 - Prob. 53ECh. 12.2 - Prob. 54ECh. 12.2 - Prob. 55ECh. 12.2 - Prob. 56ECh. 12.2 - Prob. 57ECh. 12.2 - Prob. 58ECh. 12.2 - For Exercises 57-59, refer to the grouped...Ch. 12.2 - Prob. 60ECh. 12.3 - 1. If your calculator finds both the sample...Ch. 12.3 - 2. If your calculator finds only one kind of...Ch. 12.3 - Find (a) the range, and (b) the standard deviation...Ch. 12.3 - Find (a) the range, and (b) the standard deviation...Ch. 12.3 - Find (a) the range, and (b) the standard deviation...Ch. 12.3 - Find (a) the range, and (b) the standard deviation...Ch. 12.3 - Find (a) the range, and (b) the standard deviation...Ch. 12.3 - Find (a) the range, and (b) the standard deviation...Ch. 12.3 - Find (a) the range, and (b) the standard deviation...Ch. 12.3 - Find (a) the range, and (b) the standard deviation...Ch. 12.3 - Use Chebyshev’s theorem for Exercises 11-22. Give...Ch. 12.3 - Use Chebyshev's theorem for Exercises 11-22. Give...Ch. 12.3 - Use Chebyshev's theorem for Exercises 11-22. Give...Ch. 12.3 - Use Chebyshev's theorem for Exercises 11-22. Give...Ch. 12.3 - Prob. 15ECh. 12.3 - Use Chebyshev's theorem for Exercises 11-22. Give...Ch. 12.3 - Prob. 17ECh. 12.3 - Use Chebyshev's theorem for Exercises 11-22. Give...Ch. 12.3 - Use Chebyshev's theorem for Exercises 11-22. Give...Ch. 12.3 - Use Chebyshev's theorem for Exercises 11-22. Give...Ch. 12.3 - Prob. 21ECh. 12.3 - Use Chebyshev's theorem for Exercises 11-22. Give...Ch. 12.3 - Prob. 23ECh. 12.3 - Travel Accommodation CostsGabriel and Lucia took a...Ch. 12.3 - Travel Accommodation Costs Gabriel and Lucia took...Ch. 12.3 - Travel Accommodation Costs Gabriel and Lucia took...Ch. 12.3 - Travel Accommodation Costs Gabriel and Lucia took...Ch. 12.3 - Travel Accommodation Costs Gabriel and Lucia took...Ch. 12.3 - In Exercises 29 and 30, two samples are given. In...Ch. 12.3 - In Exercises 29 and 30, two samples are given. In...Ch. 12.3 - Utilize the following sample for Exercises...Ch. 12.3 - Utilize the following sample for Exercises 31-36....Ch. 12.3 - Prob. 33ECh. 12.3 - Utilize the following sample for Exercises...Ch. 12.3 - Prob. 35ECh. 12.3 - Utilize the following sample for Exercises...Ch. 12.3 - 37. Comparing Water Heater Lifetimes Two brands of...Ch. 12.3 - Lifetimes of Engine Control Modules Chin manages...Ch. 12.3 - Lifetimes of Engine Control Modules Chin manages...Ch. 12.3 - Prob. 40ECh. 12.3 - 41. In Section 12.2 we showed that the mean, as a...Ch. 12.3 - Prob. 42ECh. 12.3 - A Cereal-Marketing Survey A food distribution...Ch. 12.3 - A Cereal-Marketing Survey A food distribution...Ch. 12.3 - A Cereal-Marketing Survey A food distribution...Ch. 12.3 - Prob. 46ECh. 12.3 - Prob. 47ECh. 12.3 - Prob. 48ECh. 12.3 - Prob. 49ECh. 12.3 - Prob. 50ECh. 12.3 - Prob. 51ECh. 12.3 - Prob. 52ECh. 12.4 - Numbers of Restaurant Customers Refer to the...Ch. 12.4 - Numbers of Restaurant Customers Refer to the...Ch. 12.4 - Numbers of Restaurant Customers Refer to the...Ch. 12.4 - Numbers of Restaurant Customers Refer to the...Ch. 12.4 - In Exercises 5-8, make use of z-scores.
5....Ch. 12.4 - In Exercises 5-8, make use of z-scores.
6....Ch. 12.4 - In Exercises 5-8, make use of z-scores.
7....Ch. 12.4 - In Exercises 5-8, make use of z-scores. Relative...Ch. 12.4 - World's Largest Energy Producers and Consumers The...Ch. 12.4 - World's Largest Energy Producers and Consumers The...Ch. 12.4 - World's Largest Energy Producers and Consumers The...Ch. 12.4 - World's Largest Energy Producers and Consumers The...Ch. 12.4 - World's Largest Energy Producers and Consumers The...Ch. 12.4 - World's Largest Energy Producers and ConsumersThe...Ch. 12.4 - World's Largest Energy Producers and Consumers The...Ch. 12.4 - World's Largest Energy Producers and Consumers The...Ch. 12.4 - Determine which was relatively higher: Canada in...Ch. 12.4 - Construct box plots for both production and...Ch. 12.4 - Prob. 19ECh. 12.4 - 20. Comparing your two box plots of Exercise 18,...Ch. 12.4 - The text stated that for any distribution of data,...Ch. 12.4 - 22. Describe the basic difference between a...Ch. 12.4 - Prob. 23ECh. 12.4 - This chapter has introduced three major...Ch. 12.4 - Prob. 25ECh. 12.4 - Prob. 26ECh. 12.4 - Prob. 27ECh. 12.4 - Prob. 28ECh. 12.4 - Prob. 29ECh. 12.4 - Prob. 30ECh. 12.4 - Prob. 31ECh. 12.4 - Prob. 32ECh. 12.4 - In Exercises 32-35, answer yes or no and explain...Ch. 12.4 - In Exercises 32-35, answer yes or no and explain...Ch. 12.4 - In Exercises 32-35, answer yes or no and explain...Ch. 12.4 - Prob. 36ECh. 12.4 - Prob. 37ECh. 12.4 - Prob. 38ECh. 12.4 - Prob. 39ECh. 12.4 - Prob. 40ECh. 12.4 - Prob. 41ECh. 12.4 - Prob. 42ECh. 12.4 - Prob. 43ECh. 12.4 - Prob. 44ECh. 12.4 - Prob. 45ECh. 12.4 - Prob. 46ECh. 12.4 - Prob. 47ECh. 12.4 - Prob. 48ECh. 12.4 - Prob. 49ECh. 12.4 - Prob. 50ECh. 12.4 - Prob. 51ECh. 12.4 - Prob. 52ECh. 12.4 - Prob. 53ECh. 12.4 - Prob. 54ECh. 12.5 - Identify each variable quantity as discrete or...Ch. 12.5 - Identify each variable quantity as discrete or...Ch. 12.5 - Identify each variable quantity as discrete or...Ch. 12.5 - Prob. 4ECh. 12.5 - Identify each variable quantity as discrete or...Ch. 12.5 - Prob. 6ECh. 12.5 - Measuring the Mass of Ore Samples Suppose 100...Ch. 12.5 - Measuring the Mass of Ore Samples Suppose 100...Ch. 12.5 - Measuring the Mass of Ore Samples Suppose 100...Ch. 12.5 - Measuring the Mass of Ore Samples Suppose 100...Ch. 12.5 - Distribution of IQ Scores On standard IQ tests,...Ch. 12.5 - Distribution of IQ Scores On standard IQ tests,...Ch. 12.5 - Distribution of IQ Scores On standard IQ tests,...Ch. 12.5 - Distribution of IQ Scores On standard IQ tests,...Ch. 12.5 - Find the percentage of area under a normal curve...Ch. 12.5 - Find the percentage of area under a normal curve...Ch. 12.5 - Find the percentage of area under a normal curve...Ch. 12.5 - Find the percentage of area under a normal curve...Ch. 12.5 - Find the percentage of the total area under a...Ch. 12.5 - Find the percentage of the total area under a...Ch. 12.5 - Find the percentage of the total area under a...Ch. 12.5 - Find the percentage of the total area under a...Ch. 12.5 - Find a value of z such that each condition is met....Ch. 12.5 - Find a value of z such that each condition is met....Ch. 12.5 - Find a value of z such that each condition
25....Ch. 12.5 - Find a value of z such that each condition is...Ch. 12.5 - Weights of Peaches A fruit-packing company...Ch. 12.5 - Weights of Peaches A fruit-packing company...Ch. 12.5 - Weights of Peaches A fruit-packing company...Ch. 12.5 - Weights of Peaches A fruit-packing company...Ch. 12.5 - Weights of Peaches A fruit-packing company...Ch. 12.5 - Prob. 32ECh. 12.5 - Prob. 33ECh. 12.5 - Prob. 34ECh. 12.5 - IQs of Employees A large company employs workers...Ch. 12.5 - Prob. 36ECh. 12.5 - Net Weight of Cereal Boxes A certain dry cereal is...Ch. 12.5 - Prob. 38ECh. 12.5 - Prob. 39ECh. 12.5 - Net Weight of Cereal Boxes A certain dry cereal is...Ch. 12.5 - Prob. 41ECh. 12.5 - Prob. 42ECh. 12.5 - Prob. 43ECh. 12.5 - Prob. 44ECh. 12.5 - Assume the following distributions are all normal,...Ch. 12.5 - Prob. 46ECh. 12.5 - Prob. 47ECh. 12.5 - Prob. 48ECh. 12.5 - Prob. 49ECh. 12.5 - Prob. 50ECh. 12.5 - Prob. 51ECh. 12.5 - Prob. 52ECh. 12.5 - Prob. 53ECh. 12.5 - Prob. 54ECh. 12.5 - Prob. 55ECh. 12.5 - Prob. 56ECh. 12.5 - Prob. 57ECh. 12.5 - Prob. 58ECh. 12.5 - Prob. 59ECh. 12.5 - Prob. 60ECh. 12.5 - What percentage of the items lie within 1.25...Ch. 12.5 - Prob. 62ECh. 12 - Visits to Social Networking Sites The table shows...Ch. 12 - Cheaters Never Learn The table here shows the...Ch. 12 - Use this information for Exercises 3 and 4. For...Ch. 12 - Prob. 4TCh. 12 - College Endowment AssetsThe table shows the top...Ch. 12 - College Endowment Assets The table shows the top...Ch. 12 - College Endowment Assets The table shows the top...Ch. 12 - Prob. 8TCh. 12 - Pediatrics Patients Khalida worked the 22 weekdays...Ch. 12 - Prob. 10TCh. 12 - In Exercises 11-14, find the indicated measures...Ch. 12 - In Exercises 11-14, find the indicated measures...Ch. 12 - In Exercises 11-14, find the indicated measures...Ch. 12 - Prob. 14TCh. 12 - Exam Scores in a Criminal Justice Class The...Ch. 12 - Prob. 16TCh. 12 - Use the stem-and-leaf display below for Exercises...Ch. 12 - Prob. 18TCh. 12 - Use the stem-and-leaf display below for Exercises...Ch. 12 - Use the stem-and-leaf display below for...Ch. 12 - Use the stem-and-leaf display below for...Ch. 12 - Prob. 22TCh. 12 - Triple Jump ChampionsAll Summer Olympic...Ch. 12 - Prob. 24TCh. 12 - Season Statistics in Major League Baseball The...Ch. 12 - Season Statistics in Major League Baseball The...Ch. 12 - Season Statistics in Major League Baseball The...Ch. 12 - Prob. 28TCh. 12 - Remission Data for Cocaine and Marijuana Addiction...Ch. 12 - Remission Data for Cocaine and Marijuana Addiction...
Knowledge Booster


Learn more about
Need a deep-dive on the concept behind this application? Look no further. Learn more about this topic, subject and related others by exploring similar questions and additional content below.Similar questions
- Mathematical Models In Exercises 9 and 10, (a) plot the actual data and the model of the same graph and (b) describe how closely the model represents the data. If the model does not closely represent the data, suggest another type of model that may be a better fit. The ordered pairs below give the revenues y (in billions of dollars) for Activision Blizzard, Inc., from 2008 through 2014. 2008,3.032012,4.862009,4.282013,4.582010,4.452014,4.412011,4.76 A model for the data is y=0.184t+2.32,8t14, where t represents the year, with t=8 corresponding to 2008.arrow_forwardMathematical Models In Exercises 9 and 10, (a) plot the actual data and the model of the same graph and (b) describe how closely the model represents the data. If the model does not closely represent the data, suggest another type of model that may be a better fit. The ordered pairs below give the civilian non-institutional U.S. populations y (in millions of people) 16 years of age and over not in the civilian labor force from 2006 through 2014. 2006,77.42011,86.02007,78.72012,88.32008,79.52013,90.32009,81.72014,92.02010,83.9 A model for the data is y=1.92t+65.0,6t14, where t represents the years, with t=6 corresponding to 2006.arrow_forwardWhen Date Are Unevenly speed. If data are evenly spaced, we need only calculate differences to see whether the data are linear. But if data not evenly spaced, then we must calculate the average rate of change over each interval to see whether the data are linear. If the average rate of changes is constant, it is the slope of the linear function. This fact is used in Exercises 23 and 24. In the following table, show that the average rate of change is the same over each interval. This shows the data are linear, even though the differences in y are not constant. Then find a linear model for the data. x 1 2 5 6 y 7 10 19 22arrow_forward
- Sales Barnes & Noble had annual sales of $6.8 billion in 2013 and $6.1 billion in 2015. Use the Midpoint Formula to estimate the sales in 2014. Assume that the annual sales followed a linear pattern.arrow_forwardWhen Date Are Unevenly speed. If data are evenly spaced, we need only calculate differences to see whether the data are linear. But if data are not evenly spaced, then we must calculate the average rate of change over each interval to see whether the data are linear. If the average rate of change is constant, it is the slope of the linear function. This fact is used in Exercises 23 and 24. In the following table, show that the average rate of change from 2 to 5 is not the same as the average rate of change from 5 to 6. This shows that the data are not linear, even though the differences in y are constant. x 1 2 5 6 y 3 6 9 12arrow_forward
arrow_back_ios
arrow_forward_ios
Recommended textbooks for you
 Functions and Change: A Modeling Approach to Coll...AlgebraISBN:9781337111348Author:Bruce Crauder, Benny Evans, Alan NoellPublisher:Cengage Learning
 Glencoe Algebra 1, Student Edition, 9780079039897...AlgebraISBN:9780079039897Author:CarterPublisher:McGraw Hill
 Algebra & Trigonometry with Analytic GeometryAlgebraISBN:9781133382119Author:SwokowskiPublisher:Cengage
Functions and Change: A Modeling Approach to Coll...
Algebra
ISBN:9781337111348
Author:Bruce Crauder, Benny Evans, Alan Noell
Publisher:Cengage Learning
Glencoe Algebra 1, Student Edition, 9780079039897...
Algebra
ISBN:9780079039897
Author:Carter
Publisher:McGraw Hill
Algebra & Trigonometry with Analytic Geometry
Algebra
ISBN:9781133382119
Author:Swokowski
Publisher:Cengage
Sampling Methods and Bias with Surveys: Crash Course Statistics #10; Author: CrashCourse;https://www.youtube.com/watch?v=Rf-fIpB4D50;License: Standard YouTube License, CC-BY
Statistics: Sampling Methods; Author: Mathispower4u;https://www.youtube.com/watch?v=s6ApdTvgvOs;License: Standard YouTube License, CC-BY