
Concept explainers
Videos
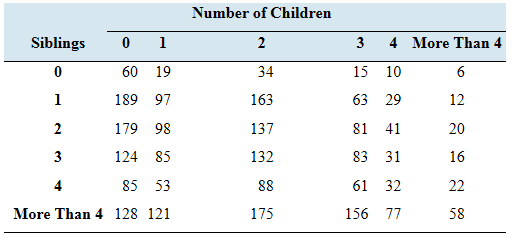
How big is your family? The General Social Survey asked a sample of 2780 adults how many children they had, and also how many siblings (brothers and sisters) they had. The results are summarized in the following
- Compute the expected frequencies.
- Compute the value of the test statistic.
- How many degrees of freedom are there?
- Test the hypothesis of independence. Using the
a.
To compute : the expected frequencies.
Answer to Problem 14E
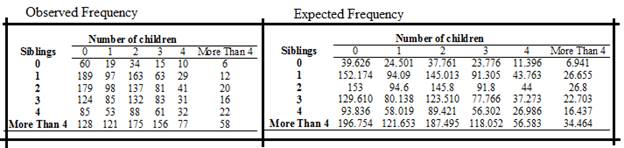
The following table presents the expected frequencies. All the expected frequencies are at least 5.
| Number of children | ||||||
| Siblings | 0 | 1 | 2 | 3 | 4 | More Than 4 |
| 0 | 39.626 | 24.501 | 37.761 | 23.776 | 11.396 | 6.941 |
| 1 | 152.174 | 94.09 | 145.013 | 91.305 | 43.763 | 26.655 |
| 2 | 153 | 94.6 | 145.8 | 91.8 | 44 | 26.8 |
| 3 | 129.610 | 80.138 | 123.510 | 77.766 | 37.273 | 22.703 |
| 4 | 93.836 | 58.019 | 89.421 | 56.302 | 26.986 | 16.437 |
| More Than 4 | 196.754 | 121.653 | 187.495 | 118.052 | 56.583 | 34.464 |
Explanation of Solution
Given information : The contingency table showing results of survey
| Number of children | ||||||
| Siblings | 0 | 1 | 2 | 3 | 4 | More Than 4 |
| 0 | 60 | 19 | 34 | 15 | 10 | 6 |
| 1 | 189 | 97 | 163 | 63 | 29 | 12 |
| 2 | 179 | 98 | 137 | 81 | 41 | 20 |
| 3 | 124 | 85 | 132 | 83 | 31 | 16 |
| 4 | 85 | 53 | 88 | 61 | 32 | 22 |
| More Than 4 | 128 | 121 | 175 | 156 | 77 | 58 |
Formula Used:
Calculation:
| Row totals reported | Column totals reported |
| Adults having … 0 sibling = 60+19+34+15+10+6=144 1 sibling = 189+97+163+63+29+12=553 2 siblings = 179+98+137+81+41+20=556 3 siblings = 124+85+132+83+31+16=471 4 siblings = 85+53+88+61+32+22=341 More Than 4 = 128+121+175+156+77+58=715 | Adults having 0 children = 60+189+179+124+85+128 = 765 1 children = 19+97+98+85+53+121= 473 2 children = 34+163+137+132+88+175= 729 3 children = 15+63+81+83+61+156 = 459 4 children = 10+29+41+31+32+77 = 220 5 children = 6+12+20+16+22+58= 134 |
| Grand total = 60+19+34+15+10+6+189+97+163+63+29+12+179+98+137+81+41+20+124+85+132+83+31 +16+85+53+88+61+32+22+128+121+175+156+77+58=2780 | |
From the results we have the below table:
| Number of children | |||||||
| Siblings | 0 | 1 | 2 | 3 | 4 | More Than 4 | Row Total |
| 0 | 60 | 19 | 34 | 15 | 10 | 6 | 144 |
| 1 | 189 | 97 | 163 | 63 | 29 | 12 | 553 |
| 2 | 179 | 98 | 137 | 81 | 41 | 20 | 556 |
| 3 | 124 | 85 | 132 | 83 | 31 | 16 | 471 |
| 4 | 85 | 53 | 88 | 61 | 32 | 22 | 341 |
| More Than 4 | 128 | 121 | 175 | 156 | 77 | 58 | 715 |
| Column Total | 765 | 473 | 729 | 459 | 220 | 134 | 2780 |
| Finding the expected frequency for the cell corresponding to: | The expected frequency |
| Adults having 0 siblings and 0 children The row total is 144, the column total is 765, and the grand total is 2780. | |
| Adults having 0 siblings and 1 children The row total is 144, the column total is 473, and the grand total is 2780. | |
| Adults having 0 siblings and 2 children The row total is 144, the column total is 729, and the grand total is 2780. | |
| Adults having 0 siblings and 3 children The row total is 144, the column total is 459, and the grand total is 2780. | |
| Adults having 0 siblings and 4 children The row total is 144, the column total is 220, and the grand total is 2780. | |
| Adults having 0 siblings and more than 4 children The row total is 144, the column total is 134, and the grand total is 2780. | |
| Adults having 1 siblings and 0 children The row total is 553, the column total is 765, and the grand total is 2780. |
| Finding the expected frequency for the cell corresponding to: | The expected frequency |
| Adults having 1 siblings and 1 children The row total is 553, the column total is 473, and the grand total is 2780. | |
| Adults having 1 siblings and 2 children The row total is 553, the column total is 729, and the grand total is 2780. | |
| Adults having 1 siblings and 3 children The row total is 553, the column total is 459, and the grand total is 2780. | |
| Adults having 1 siblings and 4 children The row total is 553, the column total is 220, and the grand total is 2780. | |
| Adults having 1 siblings and more than 4 children The row total is 553, the column total is 134, and the grand total is 2780. | |
| Adults having 2 siblings and 0 children The row total is 556, the column total is 765, and the grand total is 2780. | |
| Adults having 2 siblings and 1 children The row total is 556, the column total is 473, and the grand total is 2780. | |
| Adults having 2 siblings and 2 children The row total is 556, the column total is 729, and the grand total is 2780. | |
| Adults having 2 siblings and 3 children The row total is 556, the column total is 459, and the grand total is 2780. | |
| Adults having 2 siblings and 4 children The row total is 556, the column total is 220, and the grand total is 2780. | |
| Adults having 2 siblings and more than 4 children The row total is 556, the column total is 134, and the grand total is 2780. | |
| Adults having 3 siblings and 0 children The row total is 471, the column total is 765, and the grand total is 2780. | |
| Adults having 3 siblings and 1 children The row total is 471, the column total is 473, and the grand total is 2780. | |
| Adults having 3 siblings and 2 children The row total is 471, the column total is 729, and the grand total is 2780. | |
| Adults having 3 siblings and 3 children The row total is 471, the column total is 459, and the grand total is 2780. | |
| Adults having 3 siblings and 4 children The row total is 471, the column total is 220, and the grand total is 2780. | |
| Adults having 3 siblings and more than 4 children The row total is 471, the column total is 134, and the grand total is 2780. | |
| Adults having 4 siblings and 0 children The row total is 341, the column total is 765, and the grand total is 2780. | |
| Adults having 4 siblings and 1 children The row total is 341, the column total is 473, and the grand total is 2780. |
| Finding the expected frequency for the cell corresponding to: | The expected frequency |
| Adults having 4 siblings and 2 children The row total is 341, the column total is 729, and the grand total is 2780. | |
| Adults having 4 siblings and 3 children The row total is 341, the column total is 459, and the grand total is 2780. | |
| Adults having 4 siblings and 4 children The row total is 341, the column total is 220, and the grand total is 2780. | |
| Adults having 4 siblings and more than 4 children The row total is 341, the column total is 134, and the grand total is 2780. | |
| Adults having more than 4 siblings and 0 children The row total is 715, the column total is 765, and the grand total is 2780. | |
| Ad Adults having more than 4 siblings and 1 children The row total is 715, the column total is 473, and the grand total is 2780. | |
| Adults having more than 4 siblings and 2 children The row total is 715, the column total is 729, and the grand total is 2780. | |
| Adults having more than 4 siblings and 3 children The row total is 715, the column total is 459, and the grand total is 2780. | |
| Adults having more than 4 siblings and 4 children The row total is 715, the column total is 220, and the grand total is 2780. | |
| Adults having more than 4 siblings and more than 4 children The row total is 715, the column total is 134, and the grand total is 2780. |
The following table presents the expected frequencies. All the expected frequencies are at least 5.
| Number of children | ||||||
| Siblings | 0 | 1 | 2 | 3 | 4 | More Than 4 |
| 0 | 39.626 | 24.501 | 37.761 | 23.776 | 11.396 | 6.941 |
| 1 | 152.174 | 94.09 | 145.013 | 91.305 | 43.763 | 26.655 |
| 2 | 153 | 94.6 | 145.8 | 91.8 | 44 | 26.8 |
| 3 | 129.610 | 80.138 | 123.510 | 77.766 | 37.273 | 22.703 |
| 4 | 93.836 | 58.019 | 89.421 | 56.302 | 26.986 | 16.437 |
| More Than 4 | 196.754 | 121.653 | 187.495 | 118.052 | 56.583 | 34.464 |
b.
To compute : chi-square statistic.
Answer to Problem 14E
Explanation of Solution
Given information : The contingency table showing results of survey
| Number of children | ||||||
| Siblings | 0 | 1 | 2 | 3 | 4 | More Than 4 |
| 0 | 60 | 19 | 34 | 15 | 10 | 6 |
| 1 | 189 | 97 | 163 | 63 | 29 | 12 |
| 2 | 179 | 98 | 137 | 81 | 41 | 20 |
| 3 | 124 | 85 | 132 | 83 | 31 | 16 |
| 4 | 85 | 53 | 88 | 61 | 32 | 22 |
| More Than 4 | 128 | 121 | 175 | 156 | 77 | 58 |
Formula Used:
The chi-square test statistic is
Calculation:
From the results of previous part we have the below table:
| Finding the value of the chi-square corresponding to: | |
| Adults having 0 siblings and 0 children The observed frequency is 60 and Expected frequency is 39.626 | |
| Adults having 0 siblings and 1 children The observed frequency is 19 and Expected frequency is 24.501 | |
| Adults having 0 siblings and 2 children The observed frequency is 34 and Expected frequency is 37.761 | |
| Adults having 0 siblings and 3 children The observed frequency is 15 and Expected frequency is 23.776 | |
| Adults having 0 siblings and 4 children The observed frequency is 10 and Expected frequency is 11.396 | |
| Adults having 0 siblings and more than 4 children The observed frequency is 6 and Expected frequency is 6.941 | |
| Adults having 1 siblings and 0 children The observed frequency is 189 and Expected frequency is 152.174 | |
| Adults having 1 siblings and 1 children The observed frequency is 97 and Expected frequency is 94.09 | |
| Adults having 1 siblings and 2 children The observed frequency is 163 and Expected frequency is 145.013 | |
| Adults having 1 siblings and 3 children The observed frequency is 63 and Expected frequency is 91.305 | |
| Adults having 1 siblings and 4 children The observed frequency is 29 and Expected frequency is 43.763 | |
| Adults having 1 siblings and more than 4 children The observed frequency is 12 and Expected frequency is 26.655 | |
| Adults having 2 siblings and 0 children The observed frequency is 179 and Expected frequency is 153 | |
| Adults having 2 siblings and 1 children The observed frequency is 98 and Expected frequency is 94.6 | |
| Adults having 2 siblings and 2 children The observed frequency is 137 and Expected frequency is 145.8 | |
| Adults having 2 siblings and 3 children The observed frequency is 81 and Expected frequency is 91.8 |
| Finding the value of the chi-square corresponding to: | |
| Adults having 2 siblings and 4 children The observed frequency is 41 and Expected frequency is 44 | |
| Adults having 2 siblings and more than 4 children The observed frequency is 20 and Expected frequency is 26.8 | |
| Adults having 3 siblings and 0 children The observed frequency is 124 and Expected frequency is 129.610 | |
| Adults having 3 siblings and 1 children The observed frequency is 85 and Expected frequency is 80.138 | |
| Adults having 3 siblings and 2 children The observed frequency is 132 and Expected frequency is 123.510 | |
| Adults having 3 siblings and 3 children The observed frequency is 83 and Expected frequency is 77.766 | |
| Adults having 3 siblings and 4 children The observed frequency is 31 and Expected frequency is 37.273 | |
| Adults having 3 siblings and more than 4 children The observed frequency is 16 and Expected frequency is 22.703 | |
| Adults having 4 siblings and 0 children The observed frequency is 85 and Expected frequency is 93.836 | |
| Adults having 4 siblings and 1 children The observed frequency is 53 and Expected frequency is 58.019 | |
| Adults having 4 siblings and 2 children The observed frequency is 88 and Expected frequency is 89.421 | |
| Adults having 4 siblings and 3 children The observed frequency is 61 and Expected frequency is 56.302 | |
| Adults having 4 siblings and 4 children The observed frequency is 32 and Expected frequency is 26.986 | |
| Adults having 4 siblings and more than 4 children The observed frequency is 22 and Expected frequency is 16.437 | |
| Adults having more than 4 siblings and 0 children The observed frequency is 128 and Expected frequency is 196.754 | |
| Ad Adults having more than 4 siblings and 1 children The observed frequency is 121 and Expected frequency is 121.653 |
| Finding the value of the chi-square corresponding to: | |
| Adults having more than 4 siblings and 2 children The observed frequency is 175 and Expected frequency is 187.495 | |
| Adults having more than 4 siblings and 3 children The observed frequency is 156 and Expected frequency is 118.052 | |
| Adults having more than 4 siblings and 4 children The observed frequency is 77 and Expected frequency is 56.583 | |
| Adults having more than 4 siblings and more than 4 children The observed frequency is 58 and Expected frequency is 34.464 |
To compute the test statistics, we use the observed frequencies and expected frequency:
c.
To find : the number of degrees of freedom.
Answer to Problem 14E
The degree of freedom is
Explanation of Solution
Given information : The contingency table showing results of survey
| Number of children | ||||||
| Siblings | 0 | 1 | 2 | 3 | 4 | More Than 4 |
| 0 | 60 | 19 | 34 | 15 | 10 | 6 |
| 1 | 189 | 97 | 163 | 63 | 29 | 12 |
| 2 | 179 | 98 | 137 | 81 | 41 | 20 |
| 3 | 124 | 85 | 132 | 83 | 31 | 16 |
| 4 | 85 | 53 | 88 | 61 | 32 | 22 |
| More Than 4 | 128 | 121 | 175 | 156 | 77 | 58 |
Calculation:
A contingency table relates two qualitative variables. The row variables has on category for each row of the table. The column variable has one category for each column of the table.
d.
To perform : a test of independence, using the
Answer to Problem 14E
The test statistics
Explanation of Solution
Given information : The contingency table showing results of survey
| Number of children | ||||||
| Siblings | 0 | 1 | 2 | 3 | 4 | More Than 4 |
| 0 | 60 | 19 | 34 | 15 | 10 | 6 |
| 1 | 189 | 97 | 163 | 63 | 29 | 12 |
| 2 | 179 | 98 | 137 | 81 | 41 | 20 |
| 3 | 124 | 85 | 132 | 83 | 31 | 16 |
| 4 | 85 | 53 | 88 | 61 | 32 | 22 |
| More Than 4 | 128 | 121 | 175 | 156 | 77 | 58 |
Concept involved:
Find the critical value from Table A.4, using
Calculation:
| Degrees of freedom | Table A.4 Critical Values for the chi-square Distribution | |||||||||
| 0.995 | 0.99 | 0.975 | 0.95 | 0.90 | 0.10 | 0.05 | 0.025 | 0.01 | 0.005 | |
| 25 | 10.520 | 11.524 | 13.120 | 14.611 | 16.473 | 34.382 | 37.652 | 40.646 | 44.314 | 46.928 |
Want to see more full solutions like this?
Chapter 12 Solutions
Elementary Statistics ( 3rd International Edition ) Isbn:9781260092561


 College Algebra (MindTap Course List)AlgebraISBN:9781305652231Author:R. David Gustafson, Jeff HughesPublisher:Cengage Learning