
Videos
Contamination from a plant's discharge. Refer to the U.S. Army Corps of Engineers data (Example 1.5, p. 14 ) on fish contaminated from the toxic discharges of a chemical plant located on the banks of the Tennessee River in Alabama. Recall that the engineers measured the length (in centimeters), weight (in grams), and DDT level (in parts per million) for 144 captured fish. In addition, the number of miles upstream from the river was recorded. The data are saved in the file. (The first and last five observations are shown in the table on the next page.)
a. Fit the first-order model. E (y) = β0 + β1 x1 + β2x2 + β3x3, to the data. where y = DDT level. x1 = mile, x2 = length, and x3 = weight. Report the least squares prediction equation.
Data for Exercise 12.18
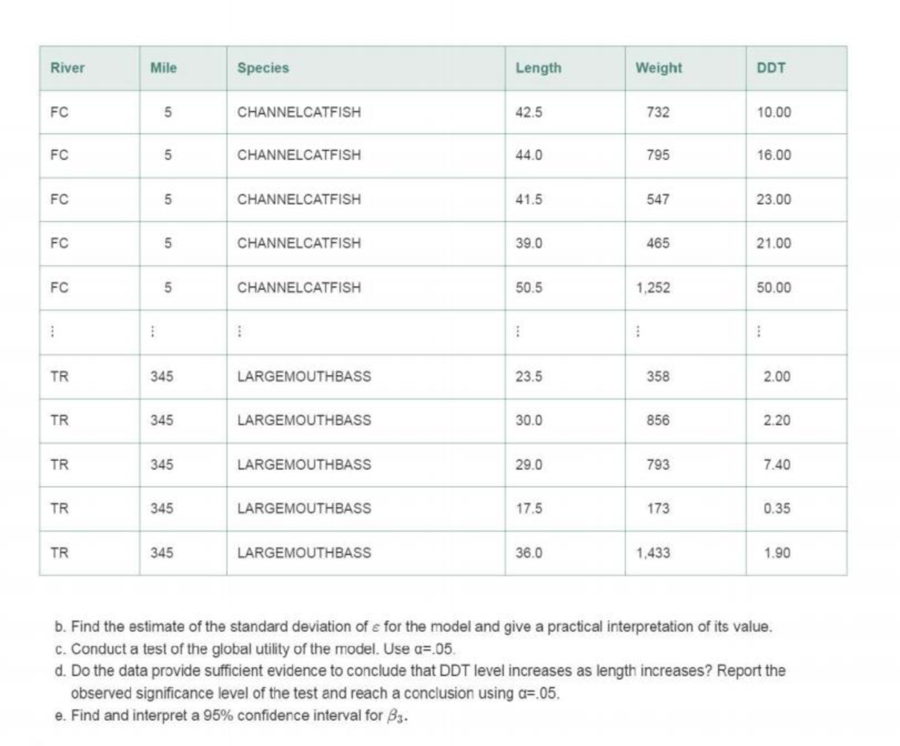
b. Find the estimate of the standard deviation of c: for the model and give a practical interpretation of its value.
c. Conduct a test of the global utility of the model. Use α =.05.
d. Do the data provide sufficient evidence to conclude that DDT level increases as length increases? Report the observed significance level of the test and reach a conclusion using α =.05.
e. Find and interpret a 95% confidence interval for β3.
Want to see the full answer?
Check out a sample textbook solution
Chapter 12 Solutions
Statistics for Business and Economics (13th Edition)


 Linear Algebra: A Modern IntroductionAlgebraISBN:9781285463247Author:David PoolePublisher:Cengage Learning
 Functions and Change: A Modeling Approach to Coll...AlgebraISBN:9781337111348Author:Bruce Crauder, Benny Evans, Alan NoellPublisher:Cengage Learning
 Glencoe Algebra 1, Student Edition, 9780079039897...AlgebraISBN:9780079039897Author:CarterPublisher:McGraw Hill