
APPLIED STAT.IN BUS.+ECONOMICS
6th Edition
ISBN: 9781259957598
Author: DOANE
Publisher: RENT MCG
expand_more
expand_more
format_list_bulleted
Concept explainers
Videos
Textbook Question
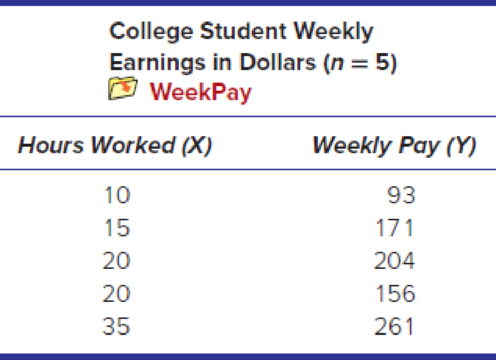
Chapter 12.5, Problem 23SE
Instructions for exercises 12.23 and 12.24: (a) Perform a regression using MegaStat or Excel. (b) State the null and alternative hypotheses for a two-tailed test for a zero slope. (c) Report the p-value and the 95 percent confidence interval for the slope shown in the regression results. (d) Is the slope significantly different from zero? Explain your conclusion.
12.23
Expert Solution & Answer
Want to see the full answer?
Check out a sample textbook solution
Students have asked these similar questions
Using the image attached, please assist with the following showing all working.
a. Would the simple regression be useful in predicting price given the number of pages of 90? In responding, state the null hypothesis(es), the decision rule for α = 0.05 and make the decision for each hypothesis.
b. Find and interpret a 90% confidence interval for the slope of the regression line.
c. Find and interpret a 95% confidence interval for the price when the pages are $50.
The Mayor of texas whom is partners with a local agriculturalist wants to know how the amount of fertilizer and the amount of water given to plants affect their growth. The results were inputted into MINITAB so as to fit the model
a) Write out the regression equation
b) What is the sample size used in this investigation?
c) Determine the values of *, ** and ***, ****
d) Conduct a hypothesis test, at the 5% level of significance, to determine whether ? is significant.
e) What would be the growth of the plant if 4g of fertilizer and 7g of ater was given to it daily?
f) Carry out an F -test at the 1% significance level to determine whether the model is significant
Listed below are altitudes (thousands of feet) and outside air temperatures (°F) recorded during a flight. Find the (a) explained variation, (b) unexplained variation, and (c) indicated prediction interval. There is sufficient evidence to support a claim of a linear correlation, so it is reasonable to use the regression equation when making predictions. For the prediction interval, use a 95% confidence level with an altitude of 6327 ft (or 6.327 thousand feet).
Altitude
2
8
13
23
28
31
32
Temperature
56
40
27
−1
−34
−41
−50
a. Find the explained variation.
(Round to two decimal places as needed.)
b. Find the unexplained variation.
(Round to five decimal places as needed.)
c. Find the indicated prediction interval.
______°F<y<______°F
Chapter 12 Solutions
APPLIED STAT.IN BUS.+ECONOMICS
Ch. 12.1 - For each sample, do a test for zero correlation....Ch. 12.1 - Instructions for Exercises 12.2 and 12.3: (a) Make...Ch. 12.1 - Prob. 3SECh. 12.1 - Prob. 4SECh. 12.1 - Instructions for exercises 12.412.6: (a) Make a...Ch. 12.1 - Prob. 6SECh. 12.2 - (a) Interpret the slope of the fitted regression...Ch. 12.2 - (a) Interpret the slope of the fitted regression...Ch. 12.2 - Prob. 9SECh. 12.2 - (a) Interpret the slope of the fitted regression...
Ch. 12.2 - (a) Interpret the slope of the fitted regression...Ch. 12.3 - Prob. 12SECh. 12.3 - Prob. 13SECh. 12.3 - The regression equation Credits = 15.4 .07 Work...Ch. 12.3 - Below are fitted regressions for Y = asking price...Ch. 12.3 - Refer back to the regression equation in exercise...Ch. 12.3 - Refer back to the regression equation in exercise...Ch. 12.4 - Instructions for exercises 12.18 and 12.19: (a)...Ch. 12.4 - Instructions for exercises 12.18 and 12.19: (a)...Ch. 12.4 - Instructions for exercises 12.2012.22: (a) Use...Ch. 12.4 - Instructions for exercises 12.2012.22: (a) Use...Ch. 12.4 - Instructions for exercises 12.2012.22: (a) Use...Ch. 12.5 - Instructions for exercises 12.23 and 12.24: (a)...Ch. 12.5 - Instructions for exercises 12.23 and 12.24: (a)...Ch. 12.5 - A regression was performed using data on 32 NFL...Ch. 12.5 - A regression was performed using data on 16...Ch. 12.6 - Below is a regression using X = home price (000),...Ch. 12.6 - Below is a regression using X = average price, Y =...Ch. 12.6 - Instructions for exercises 12.2912.31: (a) Use...Ch. 12.6 - Instructions for exercises 12.2912.31: (a) Use...Ch. 12.6 - Instructions for exercises 12.2912.31: (a) Use...Ch. 12.7 - Refer to the Weekly Earnings data set below. (a)...Ch. 12.7 - Prob. 33SECh. 12.8 - Prob. 34SECh. 12.8 - Prob. 35SECh. 12.9 - Calculate the standardized residual ei and...Ch. 12.9 - Prob. 37SECh. 12.9 - An estimated regression for a random sample of...Ch. 12.9 - An estimated regression for a random sample of...Ch. 12.9 - Prob. 40SECh. 12.9 - Prob. 41SECh. 12.9 - Prob. 42SECh. 12.9 - Prob. 43SECh. 12.11 - Prob. 44SECh. 12.11 - Prob. 45SECh. 12 - (a) How does correlation analysis differ from...Ch. 12 - (a) What is a simple regression model? (b) State...Ch. 12 - (a) Explain how you fit a regression to an Excel...Ch. 12 - (a) Explain the logic of the ordinary least...Ch. 12 - (a) Why cant we use the sum of the residuals to...Ch. 12 - Prob. 6CRCh. 12 - Prob. 7CRCh. 12 - Prob. 8CRCh. 12 - Prob. 9CRCh. 12 - Prob. 10CRCh. 12 - Prob. 11CRCh. 12 - Prob. 12CRCh. 12 - (a) What is heteroscedasticity? Identify its two...Ch. 12 - (a) What is autocorrelation? Identify two main...Ch. 12 - Prob. 15CRCh. 12 - Prob. 16CRCh. 12 - (a) What is a log transform? (b) What are its...Ch. 12 - (a) When is logistic regression needed? (b) Why...Ch. 12 - Prob. 46CECh. 12 - Prob. 47CECh. 12 - Prob. 48CECh. 12 - Instructions: Choose one or more of the data sets...Ch. 12 - Prob. 50CECh. 12 - Prob. 51CECh. 12 - Prob. 52CECh. 12 - Prob. 53CECh. 12 - Instructions: Choose one or more of the data sets...Ch. 12 - Instructions: Choose one or more of the data sets...Ch. 12 - Instructions: Choose one or more of the data sets...Ch. 12 - Prob. 57CECh. 12 - Prob. 58CECh. 12 - Prob. 59CECh. 12 - Prob. 60CECh. 12 - Prob. 61CECh. 12 - Prob. 62CECh. 12 - Prob. 63CECh. 12 - Prob. 64CECh. 12 - Prob. 65CECh. 12 - In the following regression, X = weekly pay, Y =...Ch. 12 - Prob. 67CECh. 12 - In the following regression, X = total assets (...Ch. 12 - Prob. 69CECh. 12 - Below are percentages for annual sales growth and...Ch. 12 - Prob. 71CECh. 12 - Prob. 72CECh. 12 - Prob. 73CECh. 12 - Simple regression was employed to establish the...Ch. 12 - Prob. 75CECh. 12 - Prob. 76CECh. 12 - Prob. 77CECh. 12 - Below are revenue and profit (both in billions)...Ch. 12 - Below are fitted regressions based on used vehicle...Ch. 12 - Below are results of a regression of Y = average...Ch. 12 - Prob. 81CE
Knowledge Booster


Learn more about
Need a deep-dive on the concept behind this application? Look no further. Learn more about this topic, statistics and related others by exploring similar questions and additional content below.Similar questions
- Life Expectancy The following table shows the average life expectancy, in years, of a child born in the given year42 Life expectancy 2005 77.6 2007 78.1 2009 78.5 2011 78.7 2013 78.8 a. Find the equation of the regression line, and explain the meaning of its slope. b. Plot the data points and the regression line. c. Explain in practical terms the meaning of the slope of the regression line. d. Based on the trend of the regression line, what do you predict as the life expectancy of a child born in 2019? e. Based on the trend of the regression line, what do you predict as the life expectancy of a child born in 1580?2300arrow_forwardA. At 95% confidence, determine which variables are significant and which are not. B. Remove any independent variable that is not significant from the estimate regression equation. What is your recommended estimated regression equation? Compute the R2 with the value of R2 from part (a). Discuss the differences.arrow_forwardA sociologist was hired by a large city hospital to investigate the relationship between the number of unauthorized days that employees are absent per year and the distance (miles) between home and work for the employee. A sample of 10 employees was chosen, and the following data were collected. A. Is the estimated regression equation appropriate and adequatearrow_forward
- On the first day of class, an economics professor administers a test to gauge the math preparedness of her students. She believes that the performance on this math test and the number of hours studied per week on the course are the primary factors that predict a student's score on the final exam. Using data from her class of 60 students, she estimates A portion of the regression results is shown in the following table. a. What is the slope coefficient of Hours? b. What is the sample regression equation? c. What is the predicted final exam score for a student who has a math score of 70 and studies 4 hours per week?arrow_forwardThe accompanying table lists systolic blood pressures (mm Hg) and diastolic blood pressures (mm Hg) of adult females. Find the (a) explained variation, (b) unexplained variation, and (c) prediction interval for a systolic blood pressure of 118 mm Hg using a 99% confidence level. There is sufficient evidence to support a claim of a linear correlation, so it is reasonable to use the regression equation when making predictions. Systolic Diastolic 127 69 103 65 130 73 104 64 157 74 97 51 155 90 111 69 124 68 112 75 103 60 128 67arrow_forwarda. Interpret the effect of a three (3) unit increase in Length on the response of Weight. b. The p-value to test the null hypothesis that the slope on Length is 0 (H0 : β1 = 0), isapproximately 0. What can you say about Length being a significant explanatory variable orcovariate when explaining Weight?arrow_forward
- A. Do these data provide sufficient evidence that there is a positive linear relationship between the two variables? B. What does R^2 imply? C. Using the regression model, predict the blood pressure level associated with a sound pressure of 7.5 decibels.arrow_forward18)The regression equation is intended to be the “best fitting” straight line for a set of data. Whatis the criterion for “best fitting”?arrow_forwardHawk thinks his heartrate will increase as he increases his skateboarding speed. To see if this relationship exists, he records six different speeds and models it with a scatterplot and regression output. Part A: Write the equation of the regression line using the regression output. Part B: What do the slope and intercept parameters mean using the context of the problem? Part C: Compute the margin of error that Hawk should use if he wants to provide a 99% confidence interval for the slope. Assume that conditions for inference are satisfied.arrow_forward
- The table below lists the maximum weights for which one repetition of a half-squat can be performed and times to run a 10-meter sprint for 12 international soccer players. Use technology (StatCrunch or a calculator) to help you answer the following, and round to the nearest hundredth where rounding is necessary. a. Are the variables negatively or positively correlated? b. Find and interpret the correlation coefficient r for the data. c. Find the linear regression line that best fits this data. Write it in y = a + bx form. d. Make predictions about 10-meter sprint times for soccer players who can squat 165 lbs and 250 lbs respectively. Which of these predictions is more reliable and why?arrow_forwardWould you please assist in answering this question with working out?Thank you. Q. Using a sample of recent university graduates, you estimate a simple linear regression using initial annual salary as the dependent variable and the graduate's weighted average mark (WAM) as the explanatory variable. If the regression model has an estimated intercept of 2200 and an estimated slope coefficient of 550, what is the predicted starting salary of a student with a WAM of 82?arrow_forwardThe accompanying table lists systolic blood pressures (mm Hg) and diastolic blood pressures (mm Hg) of adult females. Find the prediction interval for a systolic blood pressure of 121mm Hg using a 99% confidence level. There is sufficient evidence to support a claim of a linear correlation, so it is reasonable to use the regression equation when making predictions. Systolic Diastolic 125 69 104 65 129 75 108 65 157 74 95 53 155 89 110 69 120 69 115 73 101 59 127 67 The 99% prediction interval for a systolic blood pressure of 121mm Hg is ____mm Hg<y<___mm Hg.arrow_forward
arrow_back_ios
SEE MORE QUESTIONS
arrow_forward_ios
Recommended textbooks for you
 Functions and Change: A Modeling Approach to Coll...AlgebraISBN:9781337111348Author:Bruce Crauder, Benny Evans, Alan NoellPublisher:Cengage Learning
 Glencoe Algebra 1, Student Edition, 9780079039897...AlgebraISBN:9780079039897Author:CarterPublisher:McGraw Hill
 Algebra and Trigonometry (MindTap Course List)AlgebraISBN:9781305071742Author:James Stewart, Lothar Redlin, Saleem WatsonPublisher:Cengage Learning
Functions and Change: A Modeling Approach to Coll...
Algebra
ISBN:9781337111348
Author:Bruce Crauder, Benny Evans, Alan Noell
Publisher:Cengage Learning
Glencoe Algebra 1, Student Edition, 9780079039897...
Algebra
ISBN:9780079039897
Author:Carter
Publisher:McGraw Hill
Algebra and Trigonometry (MindTap Course List)
Algebra
ISBN:9781305071742
Author:James Stewart, Lothar Redlin, Saleem Watson
Publisher:Cengage Learning
Correlation Vs Regression: Difference Between them with definition & Comparison Chart; Author: Key Differences;https://www.youtube.com/watch?v=Ou2QGSJVd0U;License: Standard YouTube License, CC-BY
Correlation and Regression: Concepts with Illustrative examples; Author: LEARN & APPLY : Lean and Six Sigma;https://www.youtube.com/watch?v=xTpHD5WLuoA;License: Standard YouTube License, CC-BY