
Concept explainers
Videos
The following data are from a repeated-measures study comparing three treatment conditions.
- a. Use a repealed-measures ANOVA with α – 05 to determine whether there are significant differences among the treatments and compute η’ to measure the size of the treatment effect.
- b. Double the number of scores in each treatment by simply repeating the original scores in each treatment a second time. For example, the n = 8 scores in Treatment I become 1.4, 2.1, 1.4, 2.1. Note that this will not change the treatment means but it will double SSbetween treatments, SSbetween subjects, and the SS value for each treatment. For the new data, use u repeated-measures ANOVA with α - 05 to determine whether there are significant differences among the treatments and compute η’ to measure the Size of treatment effect.
- c. Describe how doubling the
sample size affected the value of the F-radio and the value of η’.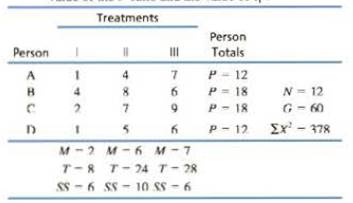
a.
To compute: The value of
Answer to Problem 11P
There are significant differences between the treatments. The value of
Explanation of Solution
Given info:
Following data are from a repeated-measure study comparing three treatments conditions.
| Treatments | |||||
| Person | I | II | III | Person totals | |
| A | 1 | 4 | 7 |
|
|
| B | 4 | 8 | 6 |
|
|
| C | 2 | 7 | 9 |
|
|
| D | 1 | 5 | 6 |
|
|
|
|
|
|
|||
|
|
|
|
|||
|
|
|
|
|||
Calculation:
The hypotheses are given below:
Null Hypothesis: There are no differences among treatments.
Alternate Hypothesis: There are significant differences among the treatments.
Let k and n represents the total numbers of treatments and participants. Then,
Let, N represents total numbers of observations. Then,
Degrees of freedom corresponding to
Degrees of freedoms corresponding to
F-ratio is given as:
From the table
Since, F-ratio is greater than the critical value; therefore, reject the null hypothesis and conclude that there are significant differences between the treatments.
Conclusion:
There are significant differences between the treatments. The value of
b.
To compute: The value of
Answer to Problem 11P
There are significant differences between the treatments. The value of
Explanation of Solution
Calculation:
The new data is obtained by doubling the number of scores in each treatment by simply repeating the original scores in each treatment a second time.
The hypotheses are given below:
Null Hypothesis: There are no differences among treatments.
Alternate Hypothesis: There are significant differences among the treatments.
Let k1 and n1 represents the total numbers of treatments and participants of the new data. Then,
Let, N1 represents total numbers of observations of new data. Then,
Degrees of freedom corresponding to
Degrees of freedoms corresponding to
F-ratio is given as:
From the table
Since, F-ratio is greater than the critical value; therefore, reject the null hypothesis and conclude that there are significant differences between the treatments for the new data.
Conclusion:
There are significant differences between the treatments. The value of
c.
Answer to Problem 11P
The F-ratio got increased and there is no effect on
Explanation of Solution
Given info:
Sample size has been doubled.
Calculation:
From part a. the F-ratio is
After doubling the sample size, from part b. the F-ratio is
But value of
Conclusion:
The F-ratio got increased and there is no effect on
Want to see more full solutions like this?
Chapter 13 Solutions
Essentials of Statistics for The Behavioral Sciences (MindTap Course List)


- The following data are from a repeated-measures experiment comparing three different treatment conditions. Participant Treatment A Treatment B Treatment C A 0 1 2 B 2 5 5 C 1 2 6 D 5 4 9 E 2 8 8 TA= 10 TB= 20 TC= 30 G= 60 SSA= 14 SSB= 30 SSc= 30 SStotal=370 Conduct a repeated measures ANOVA with alpha =.05 to determine whether there are any difference between the means. Show work for all intermediary steps and include a source table for the ANOVA and calculate the partial η2 for the effect of treatment on scores. conduct any post hoc tests to determine mean differences (if the ANOVA is significant). Set up a dataset on SPSS with data from the last problem. Calculate the ANOVA and partial η2 and report the F statistic in APA format:arrow_forwardThe following data are from an experiment comparing three treatment conditions. Use an ANOVA with alpha = .05 to determine if there are any significant population mean differences. Treatments A B C Total 0 1 2 3 2 5 5 12 1 2 6 9 5 4 9 18 2 8 8 18 2 4 6 10 20 30 60 34 110 210 354 If the experiment uses an independent design (Chapter 10), can the researchers conclude there is a significant difference? What is the F-value for your test statistic? Do you retain or reject? Whether the ANOVA was significant or not, do a Tukey’s post hoc test? What is your HSD? What do you conclude?arrow_forwardThe data below are from an independent-measures experiment comparing three different treatment conditions. Use an ANOVA with a = .05 to determine whether these data indicate any significant differences among the treatments Treatment 1 Treatment 2 Treatment 3 0 1 4 N = 12 0 4 3 G = 24 0 1 6 åX2 = 92 2 0 3 M = 0.5 T = 2 M = 1.5 T = 6 M = 4 T = 16 SS = 3 SS = 9 SS = 6arrow_forward
- The following summary table presents the results from an ANOVA comparing three treatment conditions with n = 8 participants in each treatment. Complete all missing values. (Hint: Start with the df) Source SS df MS Between tx ___ ___ 20 F= Within tx ___ ___ ___ Total 124 ___arrow_forwardThe following summary table presents the results from an ANOVA comparing three treatment conditions with n = 12 participants in each condition. Complete the missing values. (Hint: State with the df column). Source SS df MS Between ___ ___ 9 F = ___ Within ___ ___ ___ Total 117 ___arrow_forwardTo combat antibiotic resistance, the Quality Improvement Consortium recommends a throat swab to confirm strep throat before a physician prescribes antibiotics to children under age 5. Nationally, 40 percent of children under 5 who received antibiotics did not have a throat swab. The Colorado Department of Health took a random sample of 60 children under the age of 5 who received antibiotics for throat infections and found that 18 did not have a throat swab. At α = .05, is this a statistically significant reduction over last year’s national rate of 40 percent? (a-1) Calculate the critical value. (A negative value should be indicated by a minus sign. Round your answer to 3 decimal places.) Critical value _____ (a-2) Calculate the test statistic. (A negative value should be indicated by a minus sign. Round your answer to 2 decimal places.) Test statistic _____arrow_forward
- To combat antibiotic resistance, the Quality Improvement Consortium recommends a throat swab to confirm strep throat before a physician prescribes antibiotics to children under age 5. Nationally, 40 percent of children under 5 who received antibiotics did not have a throat swab. The Colorado Department of Health took a random sample of 100 children under the age of 5 who received antibiotics for throat infections and found that 30 did not have a throat swab. At α = .05, is this a statistically significant reduction over last year’s national rate of 40 percent? (a-1) Choose the correct null and alternative hypotheses. H0: π ≥ .40 vs. H1: π < .40 H0: π ≤ .40 vs. H1: π > .40 H0: π = .40 vs. H1: π ≠ .40 (a-2) Calculate the critical value. (A negative value should be indicated by a minus sign. Round your answer to 3 decimal places.) Critical value (a-3) Calculate the test statistic. (A negative value should be indicated by a minus sign. Round your…arrow_forwardfor an experiment involving 3 levels of factor A and 3 levels of factor B with a sample of n=8 in each treatment condition, what are the df values for the F-factor for the A * B (A multiplied by B) interaction?arrow_forwardConsider the following measurements of blood hemoglobin concentrations (in g/dL) from three human populations at different geographic locations: population1 = [ 14.7 , 15.22, 15.28, 16.58, 15.10 ] population2 = [ 15.66, 15.91, 14.41, 14.73, 15.09] population3 = [ 17.12, 16.42, 16.43, 17.33] What is the standard error of the difference between the means of population 1 and population 3, needed to calculate the Tukey-Kramer q-statistic? What is the Tukey-Kramer q-statistic for populations 1 and 3? (Report the absolute value, if you get a negative number, multiply by -1)arrow_forward
- A sample of 124 kissing couples were observed, with 44 of them leaning their heads to the left. Use these sample data to test whether or not the population proportion of kissing couples who lean their heads to the left differs from 1/3. What is the z and p-value?arrow_forwardThe following data were obtained from an independent-measures study comparing three treatment conditions. Treatment 1 2 3 n=6 n=6 n=6 M=1 M=2 M=6 SS=60 SS=65 SS=40 N= 18 G= 54 Sum of squares X^2= 411 Conduct an ANOVA with to determine whether there are any significant differences among the three treatment means. (alpha=.05)arrow_forwardWhat statistical test would you use for each of the following scenarios? What would you set your alpha-level at? Sarah wants to know how gender impacts heart rate recovery after a maximal exercise test. In order to test this, she has both male and female athletes come into her lab and she measures both resting heart rate before the exercise test and heart rate immediately, 10 minutes, 20 minutes and 30 minutes following the exercise test. In order for her to determine whether heart rate differs pre-post exercise between males and females what statistical test might she use? Why?arrow_forward
 Glencoe Algebra 1, Student Edition, 9780079039897...AlgebraISBN:9780079039897Author:CarterPublisher:McGraw Hill