
Concept explainers
a.
To Identify: The company which appears to be the largest at the end of Year 3.
a.
Answer to Problem 13.4MAD
The company which appears to be the largest using the revenue at the end of Year 3 is Company AT.
Explanation of Solution
Company AT has more revenue of $163,786 which is more than the revenue of Company F of revenue $27,638. Hence, Company AT appears to be the largest using the revenue at the end of Year 3.
b.
To Identify: The company which appears to be growing faster across the three years.
b.
Explanation of Solution
Identify the company which appears to be growing faster across the three years.
| Company | Year 3 | Year 2 | Year 1 |
| AT | 123% (1) | 110% (2) | 100% |
| F | 221% (3) | 143% (4) | 100% |
Table (1)
Working Note:
Calculate the growth rate of Company AT for the two years.
Calculate the growth rate of Company F for the two years.
Hence, the company which appears to be growing faster across the three years is Company F.
c.
To Compute: The cash used to purchase property, plant, and equipment as a percent of the
c.
Explanation of Solution
Compute the cash used to purchase property, plant, and equipment as a percent of the cash flows from operating activities for all three years for each company.
| Company | Year 3 | Year 2 | Year 1 |
| AT | 56% (5) | 56% (6) | 68% (7) |
| F | 28% (8) | 24% (9) | 25% (10) |
Table (2)
Working Note:
Calculate the cash used to purchase property, plant, and equipment as a percent of the cash flows from operating activities of Company AT for three years.
For Year 3:
For Year 2:
For Year 1:
Calculate the cash used to purchase property, plant, and equipment as a percent of the cash flows from operating activities of Company F for three years.
For Year 3:
For Year 2:
For Year 1:
d.
To Identify: The company which appears to require more cash to purchase property, plant, and equipment and to explain its impact on
d.
Answer to Problem 13.4MAD
By using the computation in (C), it is clear that the company which appears to require more cash to purchase property, plant, and equipment is Company F, and its impact on free cash flow is more negative.
Explanation of Solution
The cash used to purchase property, plant, and equipment as a percent of the cash flows from operating activities of Company F for Year 1 is 25% which is much less than that of Company F of 68%. But for Year 2, and Year 3, the cash used to purchase property, plant, and equipment as a percent of the cash flows from operating activities of Company AT are 56%, and 56%, which are greater than those of Company F of 24%, and 28%.
Hence, as the cash used to purchase property, plant, and equipment as a percent of the cash flows from operating activities of Company F from Year 1 to Year 3 is increasing, the company which appears to require more cash to purchase property, plant, and equipment is Company F and its net impact on free cash flow is more negative.
e.
To Compute: The ratio of free cash flow to revenue for all three years for each company.
e.
Explanation of Solution
Compute the free cash flow of Company AT.
| Year 3 | Year 2 | Year 1 | |
| Cash flows from operating activities | $ 39,344 | $35,880 | $ 31,338 |
Cash used to purchase property, plant, and equipment |
(22,408) |
(20,015) |
(21,433) |
| Free cash flow | $ 16,936 | $15,865 | $ 9,905 |
Table (3)
Compute the ratio of free cash flow to revenue for Company AT.
| Year 3 | Year 2 | Year 1 | |
| Free cash flow (A) | $ 16,936 | $15,865 | $ 9,905 |
| Revenue (B) | 163,786 | 146,801 | 132,447 |
| Ratio of free cash flow to revenues
|
10.3% | 10.8% | 7.5% |
Table (4)
Compute the free cash flow of Company F.
| Year 3 | Year 2 | Year 1 | |
| Cash flows from operating activities | $16,108 | $10,320 | $7,326 |
Cash used to purchase property, plant, and equipment |
(4,491) |
(2,523) |
(1,831) |
| Free cash flow | $ 11,617 | $7,797 | $ 5,495 |
Table (5)
Compute the ratio of free cash flow to revenue for Company F.
| Year 3 | Year 2 | Year 1 | |
| Free cash flow (A) | $ 11,617 | $7,797 | $ 5,495 |
| Revenue (B) | 27,638 | 17,928 | 12,466 |
| Ratio of free cash flow to revenues
|
42% | 43.4% | 44% |
Table (6)
Hence, the ratio of free cash flow to revenue for Year 3, Year 2, and Year 1 for Company AT are 10.3%, 10.8%, and 7.5% respectively. And for Company F, they are 42%, 43.4%, and 44% respectively.
F.
To plot: The data on a line chart with the years on the horizontal axis.
F.
Explanation of Solution
Plot the data on a line chart with the years on the horizontal axis.
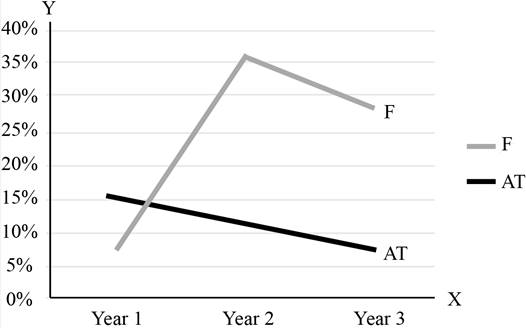
Figure (1)
The ratio of free cash flow to revenue of Company AT for Year 1 was better when compared to Company F. But in the Year 2, and Year 3, the ratios of free cash flow to revenue of Company F were much greater than Company AT. The cash flows from operating activities of Company F have significantly increased over the years. Due to this, there is an increase in the ratio of free cash flows to revenues. The decline in the ratio of free cash flows to revenues of Company AT is due to the decline in the cash flows from operating activities, and increase in the cash needed to purchase property, plant, and equipment over the three years. The net result of this is that the ratio is declined.
Want to see more full solutions like this?
Chapter 13 Solutions
Bundle: Corporate Financial Accounting, Loose-leaf Version, 15th + CengageNOWv2, 1 term Printed Access Card


- For each of the following companies, determine what they primarily sell and whether their e-commerce strategy is primarily business-to-consumer (B2C), business-to-business (B2B), or both. Use the Internet to investigate each companys site in conducting your research. a. Amazon.com b. Dell Inc. c. DuPont d. Intuit Inc. e. L.L. Bean, Inc. f. W.W. Grainger, Inc.arrow_forwardBased on Bitmovin Inc : A start up goes global casearrow_forwardA fairly recent technology-related tool that many companies use to solicit feedback from customers about the company’s existing or upcoming products is a. market segmenting. b. customer relationship management. c. consumer buying behavior. d. sales forecasts. e. social media.arrow_forward
- Discuss the difference between business-to-business and business-to-costumer. Provide a specific example How do business Intelligence works? Site a specific scenario. What are the challenges of global information systems?arrow_forwardIn SAP Business ByDesign Built-In Analytics, what can a business user create using the multidimensional analysis pattern? Key figures Data sources Personal dashboards Personal selections and views please choose he correct answerarrow_forwardQuestion 4: A major difference between traditional media networks and online social networks is that within online SNS environments, members serve as; select all that apply A Producers B Consumers C Policy makers D Gate keepersarrow_forward
- Infosys is a successful software company with more than 200,000 employees. Social media are integral to its strategy and communications approach. The company uses social media to engage younger employees in these processes and to empower them. In order to do this, the company created STRAP Surround as a social platform to engage employees and allow executives to teach. It contains blogs, discussion forums, an in-house version of YouTube for video sharing, and a range of physical activities and games. The system has provided a mountain of data on its workforce for executives to process. Here is one example. Employees participated in a series of live events related to a strategy execution topic. These events resulted in tens of thousands of ideas shared via social media. Through these events, management discovered some new things about the effectiveness of different communica- tions media. For example, social media was most effective for structured questions, such as those asking about…arrow_forwardGive example and explain with structure how some of the real-life companies (e.g Microsoft and etc ) are using enterprise modeling.arrow_forwardIn addition to B2B and B2C transactions, the Internet is commonly used in all of the following business activities except a.customer relationship management b.product life-cycle management c.supply chain management d.regulatory compliance managementarrow_forward
- Why are customer relationships important to an organization? Do you agree that every business needs to focus on customers to survive in the information age?arrow_forwardIntegration is the buzzword for all systems including the Accounting Information Systems (AIS). Give TEN (10) reasons how an integrated AIS will benefit an organization. Provide examples appropriately. Please give explanation in details with example for each point.arrow_forwardMasterCard makes its analytics tools available to all of its member banks and other issuers. It knows that getting its clients to use these tools can be critical to keeping them as loyal customers. Discuss the steps that MasterCard can take to promote greater use of its BI and reporting tools by its clients. Who do you think larger or smaller clients will benefit most from MasterCard’s analytics tools? Why?arrow_forward
 Financial AccountingAccountingISBN:9781337272124Author:Carl Warren, James M. Reeve, Jonathan DuchacPublisher:Cengage Learning
 Managerial Accounting: The Cornerstone of Busines...AccountingISBN:9781337115773Author:Maryanne M. Mowen, Don R. Hansen, Dan L. HeitgerPublisher:Cengage Learning
 Financial Reporting, Financial Statement Analysis...FinanceISBN:9781285190907Author:James M. Wahlen, Stephen P. Baginski, Mark BradshawPublisher:Cengage Learning
 Business/Professional Ethics Directors/Executives...AccountingISBN:9781337485913Author:BROOKSPublisher:Cengage
 Accounting Information SystemsAccountingISBN:9781337619202Author:Hall, James A.Publisher:Cengage Learning,
 Pkg Acc Infor Systems MS VISIO CDFinanceISBN:9781133935940Author:Ulric J. GelinasPublisher:CENGAGE L