
Videos
a.1
Compute the
a.1
Explanation of Solution
Current ratio: Current ratio is one of the
The current ratio for the Company C is as follows:
The current ratio for the Company W is as follows:
Hence, the current ratio of the Company C and Company W is 1.10:1 and 0.88:1
a.2
Compute the average days to sell inventory for the companies’ 2012 fiscal years.
a.2
Explanation of Solution
Average days to sell inventory: This ratio is determined as the number of days a particular company takes to make sales of the inventory available with them. It is calculated by using the formula:
The average days to sell inventory for the Company C is as follows:
The average days to sell inventory for the Company W is as follows:
Hence, the average days to sell inventory of the Company C and Company W is 29 days and 42 days.
a.3
Compute the debt to asset ratio for the companies’ 2012 fiscal years.
a.3
Explanation of Solution
Debt to assets ratio: The debt to asset ratio shows the relationship between total asset and the total liability of the company. Debt ratio reflects the financial strategy of the company. It is used to measure the percentage of company’s assets that are financed by long term debts. Debt to assets ratio is calculated by using the formula:
The debt to asset ratio for the Company C is as follows:
The debt to asset ratio for the Company W is as follows:
Hence, the debt to asset ratio of the Company C and Company W is 54%and 61%.
a.4
Compute the return on investment for the companies’ 2012 fiscal years.
a.4
Explanation of Solution
Return on investments (assets): Return on investments (assets) is the financial ratio which determines the amount of net income earned by the business with the use of total assets owned by it. It indicates the magnitude of the company’s earnings with relative to its total assets. Return on investment is calculated as follows:
The return on investments for the Company C is as follows:
The return on investments for the Company W is as follows:
Hence, the return on investments of the Company C and Company W is 10.3%and 13%.
a.5
Compute the gross margin percentage for the companies’ 2012 fiscal years.
a.5
Explanation of Solution
Gross margin percentage: It is one of the profitability ratios. Gross margin ratio is used to measure the percentage of gross profit that is being generated per dollar of revenue or sales. It is calculated by using the formula::
The gross margin percentage for the Company C is as follows:
The gross margin percentage for the Company W is as follows:
Hence, the gross margin percentage of the Company C and Company W is 12.4%and 25%.
a.6
Compute the asset turnover ratio for the companies’ 2012 fiscal years.
a.6
Explanation of Solution
Asset turnover: Turnover of assets is a ratio that measures the productive capacity of the total assets to generate the sales revenue for the company. Thus, it shows the relationship between the net sales and the average total assets. Turnover of assets is calculated as follows:
The asset turnover for the Company C is as follows:
The asset turnover for the Company W is as follows:
Hence, the asset turnover of the Company C and Company W is 3.7 times and 2.4 times.
a.7
Compute the return on asset for the companies’ 2012 fiscal years.
a.7
Explanation of Solution
Return on sales: It is one of the profitability ratios. Profit margin ratio is used to measure the percentage of net income that is being generated per dollar of revenue or sales. It is calculated by using the formula:
The return on sales for the Company C is as follows:
The return on sales the Company W is as follows:
Hence, the return on sales of the Company C and Company W is 2.8% and 5.5%.
a.8
Compute the return on asset for the companies’ 2012 fiscal years.
a.8
Explanation of Solution
Plant assets to long term debt: Plant assets to long term debt ratio measure the value of assets per each dollar of long term liabilities. It is calculated by using the formula:
The plant assets to long term debt for the Company C is as follows:
The plant assets to long term debt for the Company W is as follows:
Hence, the plant assets to long-term debt of the Company C and Company W are 5.5:1 and 2.0:1.
Working Note:
Determine the average inventory for both the companies.
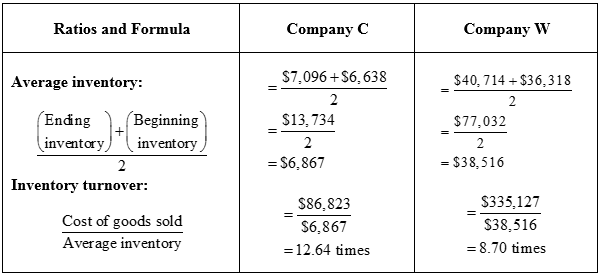
Table (2)
Determine the average total assets for both the companies.
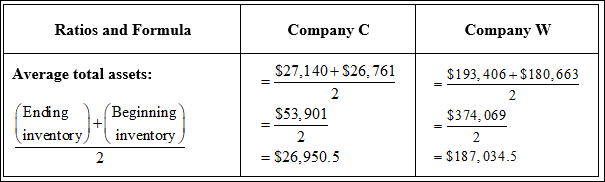
Table (3)
b.
Identify the company that appears to be more profitable. Identify the ratio that reveals the profitability using requirement a. and justify the conclusion.
b.
Explanation of Solution
The ratios that are most relevant for determining profitability are as follows:
- 1) Return on investment: Return on investments (assets) is the financial ratio which determines the amount of net income earned by the business with the use of total assets owned by it. It indicates the magnitude of the company’s earnings with relative to its total assets.
- 2) Return on sales: It is one of the profitability ratios. Profit margin ratio is used to measure the percentage of net income that is being generated per dollar of revenue or sales.
The return on investment and return on sales of Company W is 13% and 5.5% respectively, which is substantially higher than the profitability ratios of Company C.
c.
Identify the company that has higher level of financial risk. Identify the ratio that reveals the financial risk using requirement a. and justify the conclusion.
c.
Explanation of Solution
The ratios that are most relevant for determining profitability are as follows:
- 1) Current ratio: Current ratio is one of the liquidity ratios, which measures the capacity of the company to meet its short-term obligations using its current assets.
- 2) Debt to assets ratio: The debt to asset ratio shows the relationship between total asset and the total liability of the company. Debt ratio reflects the financial strategy of the company. It is used to measure the percentage of company’s assets that are financed by long term debts.
- 3) Plant assets to long term debt: Plant assets to long term debt ratio measure the value of assets per each dollar of long term liabilities.
The current ratio, Debt to assets ratio and plant assets to long term debt of Company C is 1.10:1, 54% and 5.5:1 respectively, which indicates that Company C is having higher level of financial risk .
d.
Identify the company that charges higher prices for the goods. Identify the ratio that reveals the information using requirement a. and justify the conclusion.
d.
Explanation of Solution
The ratios that are most relevant for determining the cost of goods of both the companies is the gross margin percentage. The gross margin ratio is used to measure the percentage of gross profit that is being generated per dollar of revenue or sales. The gross margin of Company W is 25.0% that is significantly higher than Company C. higher gross margin indicates that Company W is charging the most of its goods with respect to what it pays for the items it sells.
e.
Identify the company that is efficiently using its assets. Identify the ratio that reveals the profitability using requirement a. and justify the conclusion.
e.
Explanation of Solution
The ratios that are most relevant for determining the efficient utilization of assets are as follows:
- 1) Average days to sell inventory: This ratio is determined as the number of days a particular company takes to make sales of the inventory available with them.
- 2) Asset turnover: Turnover of assets is a ratio that measures the productive capacity of the total assets to generate the sales revenue for the company. Thus, it shows the relationship between the net sales and the average total assets
The average days to sell inventory of Company C is 29 days which indicates that Company C is utilizing the inventory efficiently than Company W. However, the asset turnover of Company C is 3.7 times whereas of Company W is 2.4 times, that indicates the efficiency of Company C to earn higher turnover using its total assets.
Want to see more full solutions like this?
Chapter 13 Solutions
Fundamental Managerial Accounting Concepts with Access


 AccountingAccountingISBN:9781337272094Author:WARREN, Carl S., Reeve, James M., Duchac, Jonathan E.Publisher:Cengage Learning,
 Accounting Information SystemsAccountingISBN:9781337619202Author:Hall, James A.Publisher:Cengage Learning,
 Horngren's Cost Accounting: A Managerial Emphasis...AccountingISBN:9780134475585Author:Srikant M. Datar, Madhav V. RajanPublisher:PEARSON
 Intermediate AccountingAccountingISBN:9781259722660Author:J. David Spiceland, Mark W. Nelson, Wayne M ThomasPublisher:McGraw-Hill Education
 Financial and Managerial AccountingAccountingISBN:9781259726705Author:John J Wild, Ken W. Shaw, Barbara Chiappetta Fundamental Accounting PrinciplesPublisher:McGraw-Hill Education