
Videos
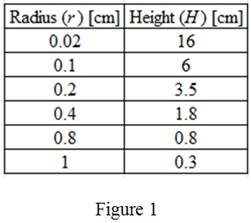
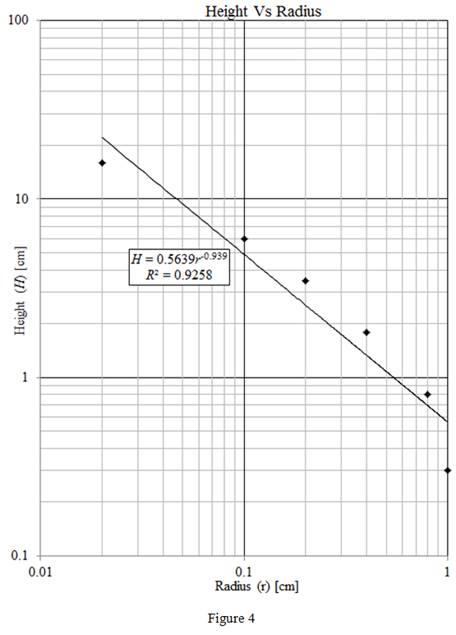
Capillary action draws liquid up a narrow tube against the force of gravity as a result of surface tension. The height the liquid will move up the tube depends on the radius of the tube. The following data were collected for water in a glass tube in air at sea level. Show the resulting data and trendline with equation and R2 value, on the appropriate graph type (rectilinear, semilog, or log–log) to make the data appear linear

Show the resulting data and trend lines with equation and
Answer to Problem 1ICA
The data and trend line with equation and
Explanation of Solution
Description:
Step 1: Open the Excel Sheet, and enter the data as shown in Figure 1.
Step 2: Select all the data from columns Radius and Height.
Step 3: Now, go to the Insert tab in the Excel and click on the Scatter Plot.
Step 4: Change the property of the plot to get the linear plot as follows.
- Click on the y-axis, select format axis as shown in Figure 2.
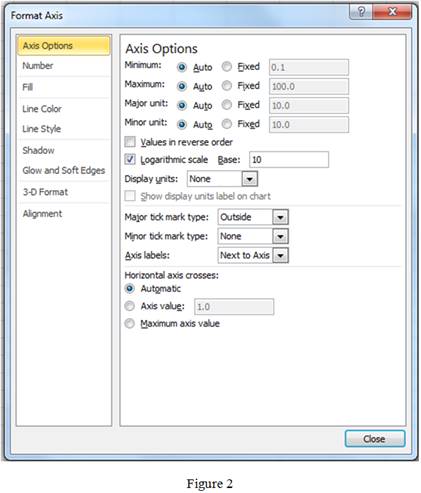
- Similarly, click on the x-axis and format the axis.
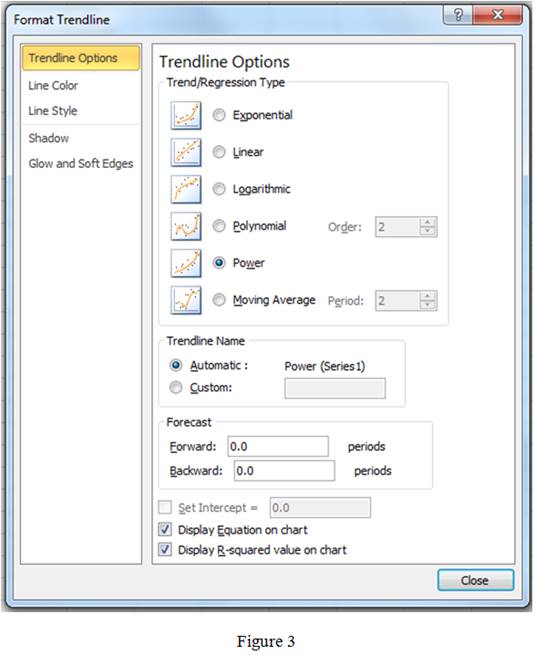
Step 5: Click on points and add trendline as shown in Figure 3.
Step 6: Label the axis of the plot properly as per the format shown below.
Step 7: Mention the title of the plot as shown in Figure 4.
Conclusion:
Hence, the data and trend line with equation and
Want to see more full solutions like this?
Chapter 13 Solutions
Thinking Like an Engineer: An Active Learning Approach (4th Edition)


- The friction in flows through the pipe is defined by a dimensionless number called the fanning friction factor (f). The Fanning friction factor is represented by another dimensionless number, the Reynolds number (Re).It depends on the diameter of the pipe and some parameters related to the fluid. An equation that can predict f given the Reynolds number is given as follows. If Re =4000, e/D=0.01 in this equation, find the value of f using the Simple Iteration method by taking f0=0.1 as the initial value for the solution (ԑ=0.0001)arrow_forwardA fixed amount of ideal gas is kept in a container of fixed volume. The absolute pressure P, in pascals, of the gas is plotted as a function of its temperature T, in degrees Celsius. Which of the following are properties of a best fit curve to the data? Select two answers. a. Having a positive slope b. Passing through the origin c. Having zero pressure at a certain negative temperature d. Approaching zero pressure as temperature approaches infinityarrow_forwardA chemical engineer desiring to study the evaporation rate of water from brine evaporation beds obtained data on the number of inches of evaporation in each of 55 July days spread over 4 years. The data are given in the following stem and leaf plot, which shows that the smallest data value was 0.02 inch, and the largest 0.56 inch. Stem Leaf 0.0 2, 6 0.1 1, 4 0.2 1, 1, 1, 3, 3, 4, 5, 5, 5, 6, 9 0.3 0, 0, 2, 2, 2, 3, 3, 3, 3, 4, 4, 5, 5, 5, 6, 6, 7, 8, 9 0.4 0, 1, 2, 2, 2, 3, 4, 4, 4, 5, 5, 5, 7, 8, 8, 8, 9, 9 0.5 2, 5, 6 Find the: a) sample mean; b) sample median; c) sample standard deviation of these data. d) Do the data appear to be approximately normal? e) What percentage of data values are within 1 standard deviation of the mean?arrow_forward
- The friction force F on a smooth sphere falling in water depends on the sphere speed V, the sphere density ρ_s and diameter D_s, the density ρ and dynamic viscosity μ of the water, gravitational acceleration g. Choose the correct repeating variables. sphere diameter, dynamic viscosity, gravitational acceleration density, gravitational acceleration, dynamic viscosity friction force, gravitational acceleration, density density, sphere speed, sphere diameter friction force, sphere speed, sphere diameterarrow_forwardAs the potential across the resistor increased, the current through the resistor increased. If the change in current is proportional to the voltage, the data should be in a straight line and it should go through zero. In these two examples how close is the y-intercept to zero? Is there a proportional relationship between voltage and current? If so, write the equation for each run in the form potential = constant x current. (Use a numerical value for the constant.)arrow_forwardUse dimentional analysis to evaluate that in a problem involving shallow water waves (figure 6), both the Froude number and the Reynold's number are relevant dimensionless parameters. The wave speed, c of waves on the surface of a liquid is a function of depth h, gravitational acceleration g, fluid density, p and fluid viscosity μ. Manipulate your II's to get the parameters into the following form: Fr = c/(gh)1/2= f(Re) , where Re = pch/μarrow_forward
- Write the primary dimensions of each of the following variables, showing all your work: (a) specific heat at constant pressure cp; (b) specific weight ? g; (c) specific enthalpy h.arrow_forwardThe amount of time it takes for a pendulum to swing “to-and-fro” through one complete cycle is called the “period” and is calculated using the following equation: where T = period in seconds, I = mass moment of inertia, m = mass of pendulum in kilograms g = gravitational acceleration, 9.8 m/s2, h = effective length of pendulum in meters What is the appropriate unit for I if the preceding equation is to be homogeneous in units? Please show all of your work.arrow_forwardApplying principles of dynamics (with step by steep solutions pls i give 5 stars) The displacement of a particle which moves along the x axis is given by x = (-4 + 3t2)e-0.25t, consider x to be in feet and t in seconds. Plot the displacement, velocity and acceleration for the first 20 seconds of motion and determine, both graphically and by your established equation for acceleration,the time at which acceleration is 0. (If the students find it more comfortable, they may choose to graph using excel or any graphing software, solutions however must be done manually)arrow_forward
- Cardiologists use the short-range scaling exponent α1, which measures the randomness of heart rate patterns, as a tool to assess risk of heart attack. The article “Applying Fractal Analysis to Short Sets of Heart Rate Variability Data” compared values of α1 computed from long series of measurements (approximately 40,000 heartbeats) with those estimated from the first 300 beats to determine how well the long-term measurement (y) could be predicted the short-term one (x). Following are the data (obtained by digitizing a graph). Short Long 0.54 0.55 1.02 0.79 1.4 0.81 0.88 0.9 1.68 1.05 1.16 1.05 0.82 1.05 0.93 1.07 1.26 1.1 1.18 1.19 0.81 1.19 0.81 1.2 1.28 1.23 1.18 1.23 0.71 1.24 Note: This problem has a reduced data set for ease of performing the calculations required. This differs from the data set given for this problem in the text. Compute the least-squares line for predicting the long-term measurement from the short-term measurement.…arrow_forwardThe velocity of the fluid flowing in a pipe with a radius of 10 cm was measured at certain points and the following table values were obtained. r=the distance of the measurement points to the center of the pipe (m) v=measured speeds (m/s) Accordingly, calculate the velocity value for r = 0.07 m by using 3rd order interpolation with the help of appropriate points that make the error minimum. In calculations, take 4 digits after the comma.arrow_forwardPlease help answer the question shown in the photo. Please explain clearly why the formulas you picked were used, and what the purpose of each number and variable in your calculation represents. Thank you!arrow_forward
 Principles of Heat Transfer (Activate Learning wi...Mechanical EngineeringISBN:9781305387102Author:Kreith, Frank; Manglik, Raj M.Publisher:Cengage Learning