
Concept explainers
Videos
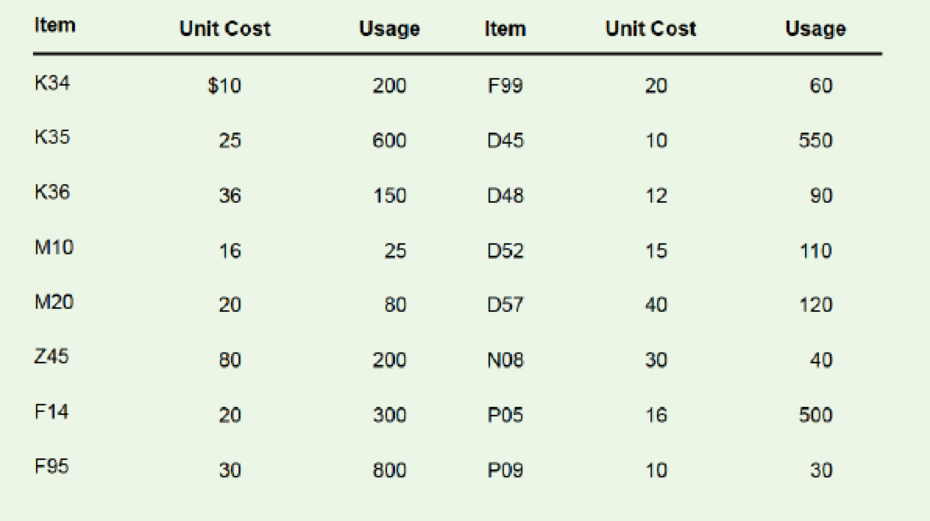
a. The following table contains figures on the monthly volume and unit costs for a random sample of 16 items from a list of 2,000 inventory items at a health care facility. Develop an A-B-C classification for these items.
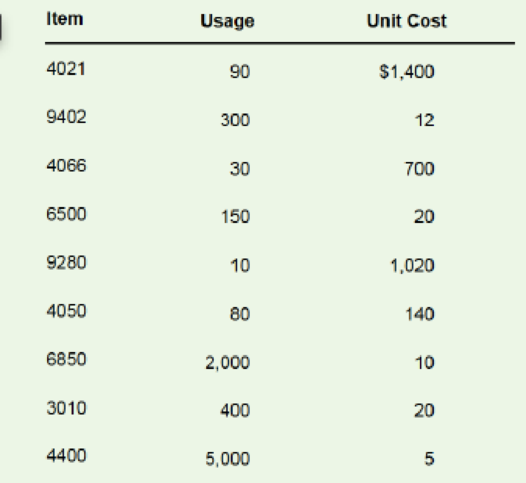
b. Given the monthly usages in the following table, classify the items in A, B, and C categories according to dollar usage.
C. Determine the percentage of items in each category and the annual dollar value for each category for pan b.
a)
To determine: ABC classification for the items.
Introduction: Inventory is a stock or store of goods. Every company store lots of goods as inventory which will be used during replenishment periods. Management of inventory is so much essential to manage cost and also to reduce cost.
Answer to Problem 2P
Explanation of Solution
Given information:
| Item | Unit Cost | Usage |
| K34 | $10 | 200 |
| K35 | 25 | 600 |
| K36 | 36 | 150 |
| M10 | 16 | 25 |
| M20 | 20 | 80 |
| Z45 | 80 | 200 |
| F14 | 20 | 300 |
| F95 | 30 | 800 |
| F99 | 20 | 60 |
| D45 | 10 | 550 |
| D48 | 12 | 90 |
| D52 | 15 | 110 |
| D57 | 40 | 120 |
| N08 | 30 | 40 |
| P05 | 16 | 500 |
| P09 | 10 | 30 |
Calculation for ABC classification:
Step 1: Calculation of annual dollar value
| Item | Unit Cost | Usage | Annual dollar value |
| K34 | $10 | 200 | $2,000 |
| K35 | 25 | 600 | $15,000 |
| K36 | 36 | 150 | $5,400 |
| M10 | 16 | 25 | $400 |
| M20 | 20 | 80 | $1,600 |
| Z45 | 80 | 200 | $16,000 |
| F14 | 20 | 300 | $6,000 |
| F95 | 30 | 800 | $24,000 |
| F99 | 20 | 60 | $1,200 |
| D45 | 10 | 550 | $5,500 |
| D48 | 12 | 90 | $1,080 |
| D52 | 15 | 110 | $1,650 |
| D57 | 40 | 120 | $4,800 |
| N08 | 30 | 40 | $1,200 |
| P05 | 16 | 500 | $8,000 |
| P09 | 10 | 30 | $300 |
| Total | $94,130 |
The annual dollar value is the product of unit cost and annual volume. For K34, the product of $10 and 200 gives $2,000 which is the dollar value for K34 and same procedure is followed for others items and the sum accounts to $94,130.
Step 2: Classification of items
| Item | Unit Cost | Usage | Annual dollar value | Category | Percentage of items | Percentage of annual dollar value |
| F95 | 30 | 800 | $24,000 | A | 18.75% | 58.43% |
| Z45 | 80 | 200 | $16,000 | |||
| K35 | 25 | 600 | $15,000 | |||
| P05 | 16 | 500 | $8,000 | B | 31.25% | 31.55% |
| F14 | 20 | 300 | $6,000 | |||
| D45 | 10 | 550 | $5,500 | |||
| K36 | 36 | 150 | $5,400 | |||
| D57 | 40 | 120 | $4,800 | |||
| K34 | $10 | 200 | $2,000 | C | 50.00% | 10.02% |
| D52 | 15 | 110 | $1,650 | |||
| M20 | 20 | 80 | $1,600 | |||
| F99 | 20 | 60 | $1,200 | |||
| N08 | 30 | 40 | $1,200 | |||
| D48 | 12 | 90 | $1,080 | |||
| M10 | 16 | 25 | $400 | |||
| P09 | 10 | 30 | $300 | |||
| Total | $94,130 |
Table 1
Excel Worksheet:
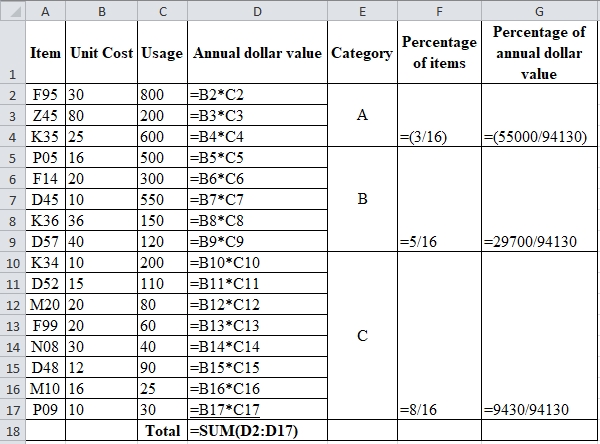
The items are classified based on their percentage of dollar value where 10-15% are classified as A items and 50% are classified as B items and lowest value are classified as C item which is shown in table 1.
Hence, ABC classification of items is shown in table 1.
b)
To determine:ABC classification for the items.
Introduction: Inventory is a stock or store of goods. Every company store lots of goods as inventory which will be used during replenishment periods. Management of inventory is so much essential to manage cost and also to reduce cost.
Answer to Problem 2P
Explanation of Solution
| Item | Usage | Unit Cost |
| 4021 | 90 | $1,400 |
| 9402 | 300 | 12 |
| 4066 | 30 | 700 |
| 6500 | 150 | 20 |
| 9280 | 10 | 1,020 |
| 4050 | 80 | 140 |
| 6850 | 2,000 | 10 |
| 3010 | 400 | 20 |
| 4400 | 5,000 | 5 |
Given information:
Calculation for ABC classification:
Step 1: Calculation of annual dollar value
| Item | Usage | Unit Cost | Annual dollar value |
| 4021 | 90 | $1,400 | $126,000 |
| 9402 | 300 | 12 | $3,600 |
| 4066 | 30 | 700 | $21,000 |
| 6500 | 150 | 20 | $3,000 |
| 9280 | 10 | 1,020 | $10,200 |
| 4050 | 80 | 140 | $11,200 |
| 6850 | 2,000 | 10 | $20,000 |
| 3010 | 400 | 20 | $8,000 |
| 4400 | 5,000 | 5 | $25,000 |
| Total | $228,000 |
The annual dollar value is the product of unit cost and annual volume. For item 4021, the product of 90 and $1400 gives $126,000 which is the dollar value for item 4021 and same procedure is followed for others items and the sum accounts to $228,000.
Step 2: Classification of items:
| Item | Usage | Unit Cost | Annual dollar value | Category | Percentage of items | Percentage of annual dollar value |
| 4021 | 90 | $1,400 | $126,000 | A | 11.11% | 55.26% |
| 4400 | 5,000 | 5 | $25,000 | B | 33.33% | 28.95% |
| 4066 | 30 | 700 | $21,000 | |||
| 6850 | 2,000 | 10 | $20,000 | |||
| 4050 | 80 | 140 | $11,200 | C | 55.56% | 15.79% |
| 9280 | 10 | 1,020 | $10,200 | |||
| 3010 | 400 | 20 | $8,000 | |||
| 9402 | 300 | 12 | $3,600 | |||
| 6500 | 150 | 20 | $3,000 | |||
| Total | $228,000 |
Table 2
Excel Worksheet:
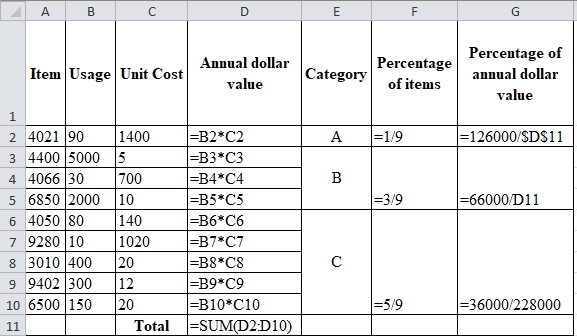
The items are classified based on their percentage of dollar value where 10-15% are classified as A items and 50% are classified as B items and lowest value are classified as C item which is shown in table 2.
Hence, ABC classification of items is shown in table 2.
c)
To determine: The percentage of items in each category and their respective annual dollar value.
Introduction: Inventory is a stock or store of goods. Every company store lots of goods as inventory which will be used during replenishment periods. Management of inventory is so much essential to manage cost and also to reduce cost.
Answer to Problem 2P
Explanation of Solution
Given information:
| Item | Unit Cost | Usage |
| K34 | $10 | 200 |
| K35 | 25 | 600 |
| K36 | 36 | 150 |
| M10 | 16 | 25 |
| M20 | 20 | 80 |
| Z45 | 80 | 200 |
| F14 | 20 | 300 |
| F95 | 30 | 800 |
| F99 | 20 | 60 |
| D45 | 10 | 550 |
| D48 | 12 | 90 |
| D52 | 15 | 110 |
| D57 | 40 | 120 |
| N08 | 30 | 40 |
| P05 | 16 | 500 |
| P09 | 10 | 30 |
Percentage of items in each category and their respective annual dollar value:
The percentage of items in each category and their respective annual dollar values are computed and shown in the classification table which is table 2.
Hence, the percentage of items in each category and their respective annual dollar value is shown in table 2,
Want to see more full solutions like this?
Chapter 13 Solutions
OPERATIONS MANAGEMENT (LL) >CUSTOM<


- What is the difference between a list of inventory items and their quantities on hand and a physical inventory?arrow_forwardUse the ABC method of classifying inventory control over the itemsin the following inventory list. Use the total cost per item column to create thelisting. In Excel with formulas Item Annual Usage (in Units) Unit cost ($) Total Cost per Item1 6,000 1.4 8,4002 1,500 10 15,0003 11,000 9.5 104,5004 6,500 2.5 16,2505 8,500 0.6 5,1006 7,000 14.5 101,5007 6,000 0.8…arrow_forwardthe following data has been provided relating to one of the essential supplies that is utilized for Barloworld logistics operations. usage is approximately 10 brackets per day during the year. the brackets are purchased from a supplier 90km away and the costs incurred include holding costs per bracket per year of R1.50, order cost per order of R18.75. the lead time is 2 days and working days per year is 250 days. advise the management on the following inventory management issues. Examine the factors that you will prioritise at Barloworld in ensuring that inventory management adds value to the organisation and improves on its competitive advantage. what would be the economic order quantity? the annual inventory holding costs. how many orders would be made each year? what would be the annual order cost? what is the time between orders and the reorder point (ROP)?arrow_forward
- 26 Which of the following statements is true with regard to cycle stock? a It is also called surplus stock. b It is received from a downstream supply chain partner. c It is seasonal in nature d It is also referred to as base stock. 27 Inventories that are in transit in containers or trucks ______. a are known as pipeline inventories b are known as in-house inventories c are relatively small in global supply chain (as compared to domestic supply chains) d are known as en route inventoriesarrow_forwardSam is at the post office to mail a package. After he pays for mailing the package, the clerk asksif he would like to buy some stamps. Sam pauses to think before he answers. He doesn’t have acredit card with him. After paying for the package, he has about $30 in his pocket. Analyze thisfrom an inventory standpoint. Identify the relevant considerations.arrow_forwardSam is at the post office to mail a package. After he pays for mailing the package, the clerk asks if he would like to buy some stamps. Sam pauses to think before he answers. He doesnt have a credit card with him. After paying for the package, he has about $30 in his pocket. Analyze this from an inventory standpoint. Identify the relevant considerations.arrow_forward
- How does the Wilson approach account for perishable or time-sensitive inventory items, and what modifications may be required for such cases?arrow_forwardEnumerate and explain the methods of inventory tracking. Give some examples of businesses where they are best applicable.arrow_forwardEmery Pharmaceutical uses an unstable chemicalcompound that must be kept in an environment where both temperatureand humidity can be controlled. Emery uses 800 poundsper month of the chemical, estimates the holding cost to be 50%of the purchase price (because of spoilage), and estimates ordercosts to be $50 per order. The cost schedules of two suppliers areas follows: a) What is the economic order quantity for each supplier?b) What quantity should be ordered, and which supplier should be used?c) What is the total cost for the most economic order size?d) What factor(s) should be considered besides total cost?arrow_forward
- Suppose that a large discount retailer with a lot of purchasing power in a supply chain requires that all suppliers incorporate a new information system that will reduce the cost of placing orders between the retailer and its suppliers as well as between the suppliers and their suppliers. Suppose also that order quantities and lead times are related; the smaller the order quantity the shorter the lead time from suppliers. Assume that all members of the supply chain use a continuous review system and EOQ order quantities. Explain the implications of the new information system for the supply chain in general and the inventory systems of the supply chain members in particular.arrow_forwardPlease Show EVERY Working VERY Clearly! Calculate the Economic Order Quantity, Total Annual Cost, Reorder Point, and ADDITIONAL Annual Cost (using a GRAPH) if the Procurement Manager increase the order quantity by 25% from the above EOQ.arrow_forwardThe following table contains figures on the monthly volume and unit costs for a random sample of 16 items from a list of 2,000 inventory items at a health care facility. a- Develop an A-B-C classification for these items.arrow_forward
 Purchasing and Supply Chain ManagementOperations ManagementISBN:9781285869681Author:Robert M. Monczka, Robert B. Handfield, Larry C. Giunipero, James L. PattersonPublisher:Cengage Learning