
(a)
The IS-LM curve of the economy.
(a)
Explanation of Solution
The IS-LM curves of the economy can be calculated from the given details. It is given that the value of
Similarly, the LM curve of the economy can be obtained by equating the money market as follows:
Mundell - Fleming model: The Mundell Fleming model is the extended version of the IS-LM model of the economy that incorporates the BOP into the equilibrium. Thus, it is the model that portrays the short run relationship between the nominal exchange rate of the economy, interest rate and the output.
(b)
The equilibrium exchange rate, income, and net exports.
(b)
Explanation of Solution
The equilibrium exchange rate of the economy can be calculated by equating the output (Y) from both the IS curve and the LM curve as follows:
Thus, the equilibrium exchange rate in the economy is 2. The equilibrium income in the economy can be calculated by substituting the value of net exports in the equation above as follows:
Thus, the equilibrium income in the economy is equal to 1,200. The net exports in the economy can be calculated by substituting the value of the exchange rate in the net exports as follows:
Thus, the net exports in the economy is equal to 100.
(c)
The IS and LM curves when the government spending increases by 50.
(c)
Explanation of Solution
When there is an increase in the government spending by 50, the new IS curve can be derived as follows:
Since the economy has the floating exchange rate, the LM curve of the economy remains unchanged. As a result, there will be no change in the income and output of the economy. Thus, the income remains at 1,200. Therefore, the new exchange rate can be calculated as follows:
Thus, the exchange rate is 3. A higher exchange rate decreases the exports as the domestic currency appreciates and becomes costly to the foreign countries. Thus, the increased government spending will be matched by a lower net exports. This can be illustrated as follows:
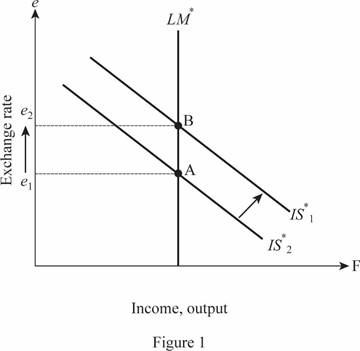
Thus, the IS curve shifts toward the right graphically, whereas the exchange rate increases.
(d)
The IS and LM curves when the government spending increases by 50 under fixed exchange rate.
(d)
Explanation of Solution
When there is an increase in the government spending by 50, the new IS equation becomes
Thus, when the exchange rate is fixed at 2, the equilibrium income should increase to 1,400. As a result, the money supply must be increased by the monetary authority to keep the exchange rate fixed at 2. Therefore, M would increase to 3,600 due to the rightward shift in the LM curve and it can be illustrated as follows:
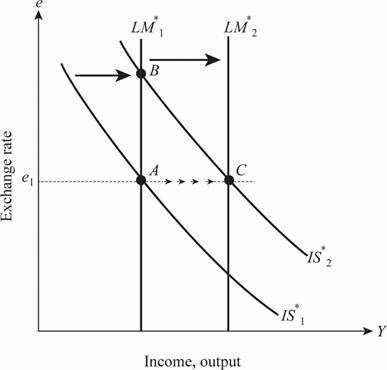
Thus, the IS curve shifts toward the right increases the exchange rate, whereas the increase in the money supply leads to the rightward shift in the LM curve which brings the exchange rate back to the original position with increased output and income.
Want to see more full solutions like this?
Chapter 13 Solutions
MACROECONOMICS+SAPLING+6 M REEF HC>IC<

- Aggregate expenditure in an open economy equals a) C + I + G + S - M b) C + I + G + T - M c) C + I + G + (X - M) d) C + I + G + (M - X)arrow_forwardAn open economy is described by the following system of macroeconomic equations, in which all macroeconomic aggregate are measured in billions of Namibian dollars, N$:Y = C + I + G + X –MC = 160 + 0.6 YdT = 100 + 0.25YX = 80I = 150G = 150M = 22 + 0.25YWhere: Yis domestic incomeYdis private disposable income C is aggregate consumption spending T is government tax revenue I is investment spending X represents exports M represents imports of goods and services. (a) Determine trade balance at equilibrium. (b) Find the multiplier applicable to autonomous tax and interpret it. (c)Use the multiplier applicable to exports, to explain how a 100 billion decline in demand for exports could have affected the economy’s: (i)GDP/ output (ii)Balance of trade (iii)Government budgetarrow_forwardA closed economy is a national economy that: a. Has extensive trading and financial relationship with other national economics b. Has a stock market that is not open to traders from outside the country c. Does not interact economically with the rest of the world d. Has established economic relations with other national economicsarrow_forward
- What do you understand by the term “closed economy”? For a closed economy show, National savings = National Investmentarrow_forwardDifferentiate between a closed economy and an open economyarrow_forwardIf the government reduces government purchases, then what happens to the real interest rate in a closed economy, small open economy, and a large open economy?arrow_forward
- If the potential output for an economy is $100 billion and the current output is $98 billion, then the output gap for the country is_____. (fill in the blankarrow_forwardIn an open economy, gross domestic product equals $2,450 billion, consumption expenditure equals $1,390 billion, government expenditure equals $325 billion, investment equals $510 billion, and net capital outflow equals $225 billion. What is national saving?arrow_forwardIf the Gross Domestic Product (GDP) is adjusted for the PPP (Purchasing Power Parity, or what a U.S. dollar can buy in each country), what would be the correct ordering of the economies if we order them from the highest to the lowest - in terms of the GDP by PPP? Please choose your answer from the below list of countries - ranked correctly from highest to the lowest, as per the 2020 IMF estimates Group of answer choices China, Germany, United States, Japan and United Kingdom. United States, China, Germany, United Kingdom, and Japan. China, United States, India, Japan and Germany.arrow_forward
- If consumption equals $6,200 billion, investment equals $1,200 billion, transfer payments equal $1,500 billion, government purchases equal $2,200 billion exports equal $900 billion imports equal $1,100 billion foreign factor income equals $200 billion Then GDP is equal to: Group of answer choices $11,100 billion $9,600 billion $10,900 billion $9,400 billionarrow_forwardDoes an open economy have better impact than closed economy? How? In what aspects? 250 wordsarrow_forwardClearly distinguish between each of the following terms: 4.4 A closed economy and an open economyarrow_forward


