
Concept explainers
Videos
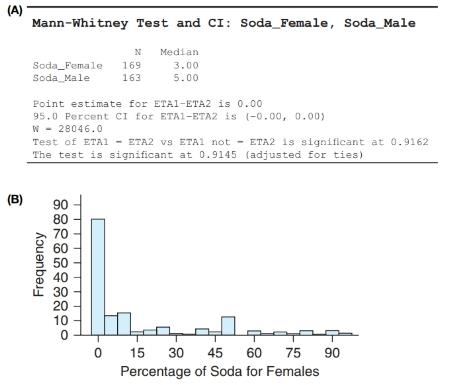
Soda A StatCrunch survey was done asking what percentage of liquid intake was in the form of soda. Figure A shows the output given.
a. Figure B is a histogram of the percentage for the females. Describe the shape of the distribution of the sample, and comment on whether it would be better to compare means or
b. Descriptively compare the percentage of liquid intake that was soda for men and the percentage for women. Who consumes the larger percentage of soda?
c. Assuming we have a random sample of StatCrunch users, test the hypothesis that the medians are not equal, using a significance level of 0.05.
Want to see the full answer?
Check out a sample textbook solution
Chapter 13 Solutions
EP INTRODUCTORY STATISTICS-MYSTATLAB
Additional Math Textbook Solutions
APPLIED STAT.IN BUS.+ECONOMICS
An Introduction to Mathematical Statistics and Its Applications (6th Edition)
Statistics for Engineers and Scientists
Stats: Modeling the World Nasta Edition Grades 9-12
Introductory Statistics
Business Statistics: A First Course (8th Edition)


 Glencoe Algebra 1, Student Edition, 9780079039897...AlgebraISBN:9780079039897Author:CarterPublisher:McGraw Hill
 Holt Mcdougal Larson Pre-algebra: Student Edition...AlgebraISBN:9780547587776Author:HOLT MCDOUGALPublisher:HOLT MCDOUGAL
 Big Ideas Math A Bridge To Success Algebra 1: Stu...AlgebraISBN:9781680331141Author:HOUGHTON MIFFLIN HARCOURTPublisher:Houghton Mifflin Harcourt