
Videos
(a)
Identify the p-value that indicates predictor significance at
(a)
Answer to Problem 32CE
The p-value for ‘% with Bachelor's Degree’ indicates predictor significance at
Explanation of Solution
Calculation:
The given information is that, the dataset of ‘Noodles & Company Sales, Seating, and Demographic data’ contains
Software procedure:
Step by step procedure to obtain p-value for predictor using MegaStat software is given as,
- • Choose MegaStat >
Correlation /Regression>Regression Analysis . - • SelectInput ranges, enter the variable
range for ‘Seats-Inside, Seats-Patio, MedIncome, MedAge, BachDeg%’ as the column of X, Independent variable(s) - • Enter the variable range for ‘Sales/SqFt’ as the column of Y, Dependent variable.
- • Click OK.
Output using MegaStatsoftware is given below:
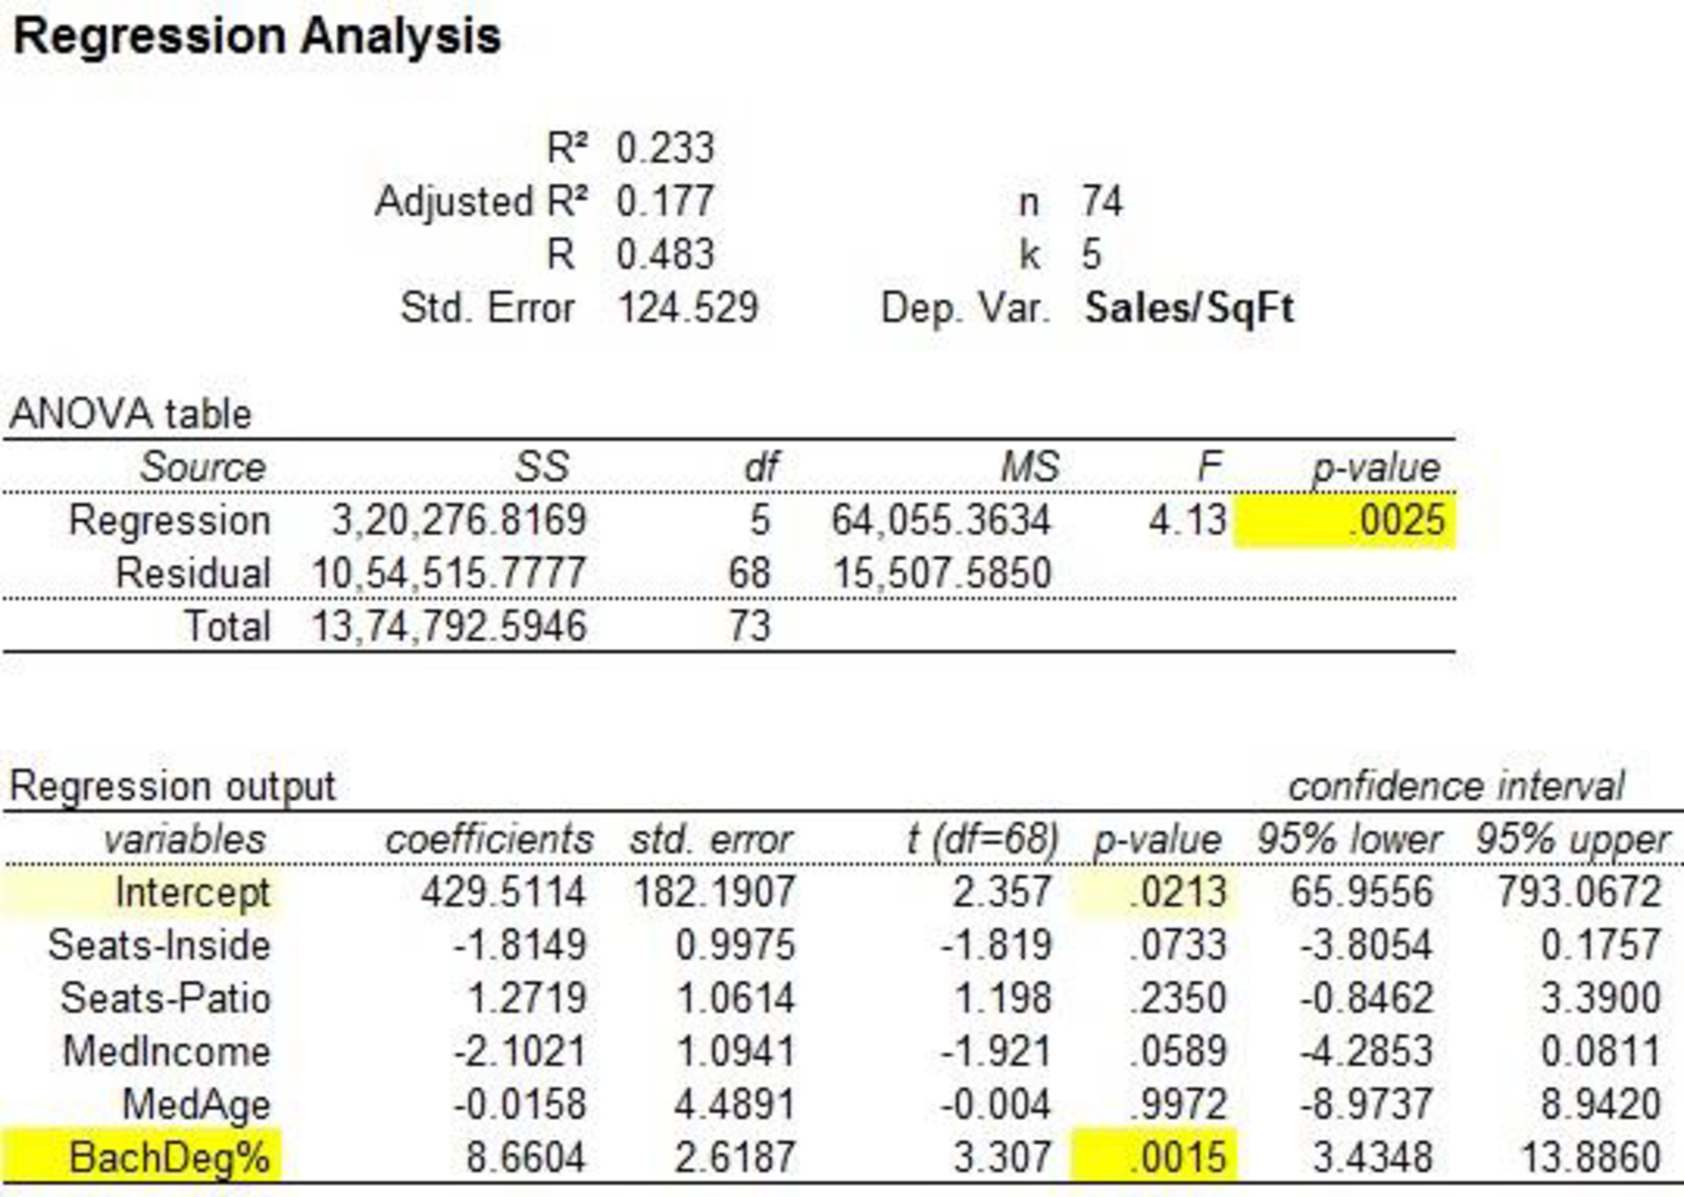
The p-value for predictor seats-inside is 0.0733.
The p-value for predictor seats-patio is 0.2350.
The p-value for predictor MedIncome is 0.0589.
The p-value for predictor MedAge is 0.9972.
The p-value for predictor BachDeg% is 0.0015.
For seats-inside:
Let
Null hypothesis:
The predictor variable seats-inside is not related to annual sales.
Alternative hypothesis:
The predictor variable seats-inside is related to annual sales.
Rejection rules:
- • If p-value is less than the level of significance then the null hypothesis is rejected. The predictor is significant.
- • If p-value is greater than the level of significance then the null hypothesis is not rejected. The predictor is not significant.
Conclusion:
The p-value for predictor seats-inside is 0.0733.
The level of significance is 0.05.
The p-value is greater than the level of significance.
That is,
The null hypothesis is not rejected.
The predictor variable seats-inside is not related to annual sales.
The predictor seats-inside is not significant.
For seats-Patio:
Let
Null hypothesis:
The predictor variable seats-Patio is not related to annual sales.
Alternative hypothesis:
The predictor variable seats-Patio is related to annual sales.
Conclusion:
The p-value for predictor seats-patio is 0.2350.
The level of significance is 0.05.
The p-value is greater than the level of significance.
That is,
The null hypothesis is not rejected.
The predictor variable seats-patio is not related to annual sales.
The predictor seats-patio is not significant.
For Median Income:
Let
Null hypothesis:
The predictor variable median income is not related to annual sales.
Alternative hypothesis:
The predictor variable median income is related to annual sales.
Conclusion:
The p-value for predictor median income is 0.0589.
The level of significance is 0.05.
The p-value is greater than the level of significance.
That is,
The null hypothesis is not rejected.
The predictor variable median income is not related to annual sales.
The predictor median income is not significant.
For Median Age of population:
Let
Null hypothesis:
The predictor variable median age of population is not related to annual sales.
Alternative hypothesis:
The predictor variable median age of population is related to annual sales.
Conclusion:
The p-value for predictor median age of population is 0.9972.
The level of significance is 0.05.
The p-value is greater than the level of significance.
That is,
The null hypothesis is not rejected.
The predictor variable median age of population is not related to annual sales.
The predictor median age of population is not significant.
For % with Bachelor's Degree:
Let
Null hypothesis:
The predictor variable % with Bachelor's Degree is not related to annual sales.
Alternative hypothesis:
The predictor variable % with Bachelor's Degree is related to annual sales.
Conclusion:
The p-value for predictor ‘% with Bachelor's Degree’ is 0.0015.
The level of significance is 0.05.
The p-value is less than the level of significance.
That is,
The null hypothesis is rejected.
The predictor variable ‘% with Bachelor's Degree’ is related to annual sales.
The predictor ‘% with Bachelor's Degree’of population is significant.
(b)
Explain whether p-values support the conclusions reached from the t tests.
(b)
Answer to Problem 32CE
Yes, p-values support the conclusions reached from the t tests.
Explanation of Solution
Justification: The conclusion reached from the t test is that the predictor variable ‘% with Bachelor's Degree’ is significant predictor and the predictor variables ‘seats-inside, seats-patio, median income, median age of population, ‘% with Bachelor's Degree’’ are not significant predictors. The conclusions for the predictor variables with the p-values at
Hence, p-values support the conclusions reached from the t tests.
(c)
Explain whether the t test or the p-value approach is preferred.
(c)
Answer to Problem 32CE
The p-value approach is preferred because it determines the strength of the significance for the predictor.
Explanation of Solution
Justification: The conclusion using the t test and p-value approach are same, but in most of the tests p-value is preferred because the strength of the significance for the predictor is better determined using the p-value when compared with the t test statistic. Hence, the p-value approach is preferred in tests.
Want to see more full solutions like this?
Chapter 13 Solutions
Loose-leaf For Applied Statistics In Business And Economics


 Glencoe Algebra 1, Student Edition, 9780079039897...AlgebraISBN:9780079039897Author:CarterPublisher:McGraw Hill
 Big Ideas Math A Bridge To Success Algebra 1: Stu...AlgebraISBN:9781680331141Author:HOUGHTON MIFFLIN HARCOURTPublisher:Houghton Mifflin Harcourt